Performance management analytics has moved from a nice-to-have reporting layer to a core part of how UK organisations run HR with confidence. For mid-market firms working across hybrid teams, the pressure is practical. Leaders need a clearer view of goal progress, manager quality, review consistency, and development follow-through without creating a culture of surveillance.
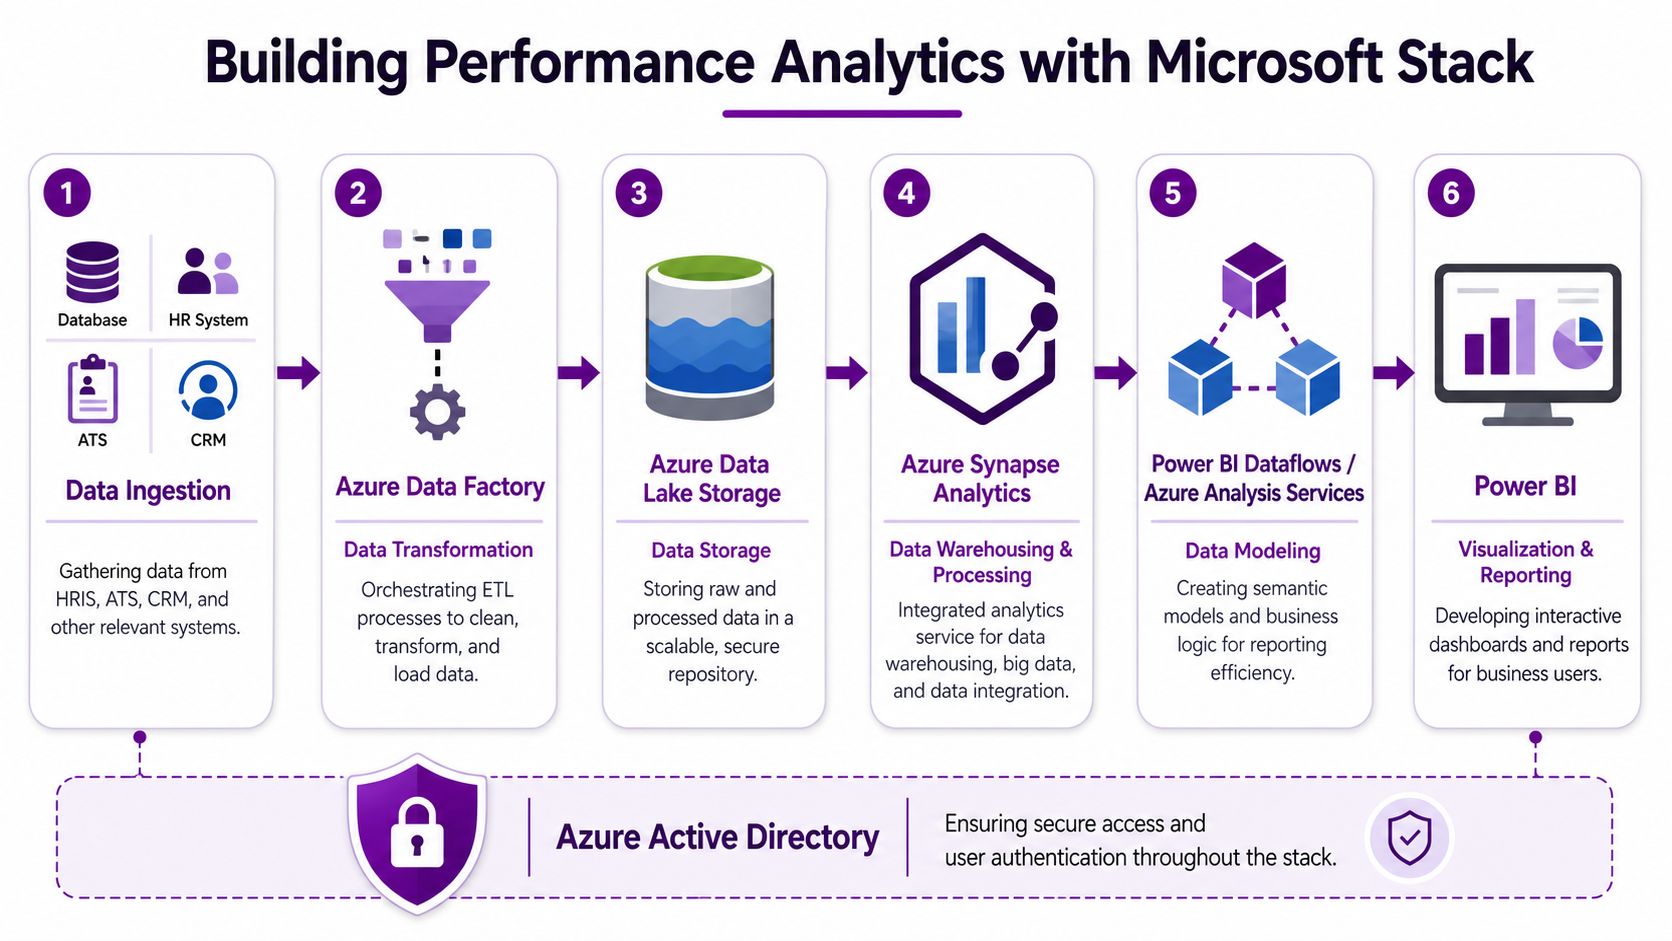
For HR and IT leaders on the Microsoft stack, the challenge is not producing another dashboard. It is building a data model that turns review notes, objectives, feedback, employee records, and engagement signals into evidence people can trust. In practice, that usually means bringing structured HR data into Dataverse, applying business rules in Dynamics 365, and exposing trends in Power BI in a way managers can act on.
Good performance analytics improves decisions early. It helps HR spot uneven manager behaviour, supports fairer calibration, and gives leadership a stronger basis for workforce planning. It also comes with trade-offs.
Collect too little data and the reporting stays superficial. Collect too much, or use it badly, and employee trust drops fast, especially in hybrid environments where people are already sensitive to monitoring. UK firms also need to handle GDPR properly, define access rules clearly, and test for bias in how ratings, promotions, and development opportunities appear across different groups. That matters for compliance, but it also matters for DEI outcomes and credibility with employees.
The practical question is how to set this up in a way that is useful, proportionate, and governable inside Microsoft 365. The organisations that do it well treat performance analytics as an operating model, not just a reporting project.
Moving Beyond the Annual Review
Two patterns show up again and again in UK mid-market firms. Employees treat the annual review as an admin exercise, and managers leave difficult conversations too late. The result is predictable. Performance issues sit unresolved, strong work goes unrecognised for months, and HR gets a year-end snapshot that is too late to improve much.
The annual cycle survives because it is easy to schedule and easy to audit. It creates a record. It rarely creates momentum.
That matters in hybrid teams, where managers see less day-to-day context and employees are more alert to how their activity is being interpreted. A single year-end rating can overstate recent work, miss quiet contribution, and harden bias if expectations were unclear from the start. For UK organisations, that is not just a people issue. It affects retention, DEI outcomes, and trust in the process itself.
Annual reviews also compress too much into one event. Goal progress, feedback quality, capability growth, and manager judgement all get reduced to a short discussion and a final score. By the time HR spots a pattern, the cost is already showing up in attrition, missed promotions, inconsistent pay decisions, or employee relations issues.
A better approach is to measure performance as an ongoing management process. That means tracking signals across the year, then checking whether managers are applying the process fairly and consistently.
Useful signals often include:
- Goal progress against agreed objectives and role expectations
- Feedback frequency and timing at manager, team, and function level
- Review quality indicators such as completeness, specificity, and follow-up actions
- Calibration variance across business units or demographic groups
- Development actions after reviews, including learning plans, mentoring, or role moves
Used well, analytics helps managers intervene earlier and helps HR challenge uneven practice with evidence. Used badly, it can feel like surveillance. That trade-off needs active design. Mid-market firms do better when they collect only the data needed to improve coaching, fairness, and follow-through, then explain clearly how that data will and will not be used.
On the Microsoft stack, this shift is practical rather than theoretical. Dataverse can store goals, check-ins, feedback records, and review outcomes in a controlled way. Dynamics 365 can support workflows, permissions, and reminders. Power BI can show where manager behaviour, completion quality, or development follow-through is drifting off course. The technical side is usually manageable. The harder part is agreeing governance, role-based access, and GDPR boundaries early so employees trust the model.
I usually advise clients to start small. Pick one business unit, define a handful of measures that managers can influence, and test whether the reporting leads to better conversations. That is how firms move from annual paperwork to HR analytics on the Microsoft platform that supports better judgement and making a measurable difference.
What Is Performance Management Analytics
Performance management analytics is often confused with HR reporting. They're related, but they aren't the same thing.
A basic HR report is your speedometer. It tells you what happened. A performance analytics model is the full dashboard and diagnostic system. It helps you understand why something is happening, where risk is building, and what action is likely to matter next.
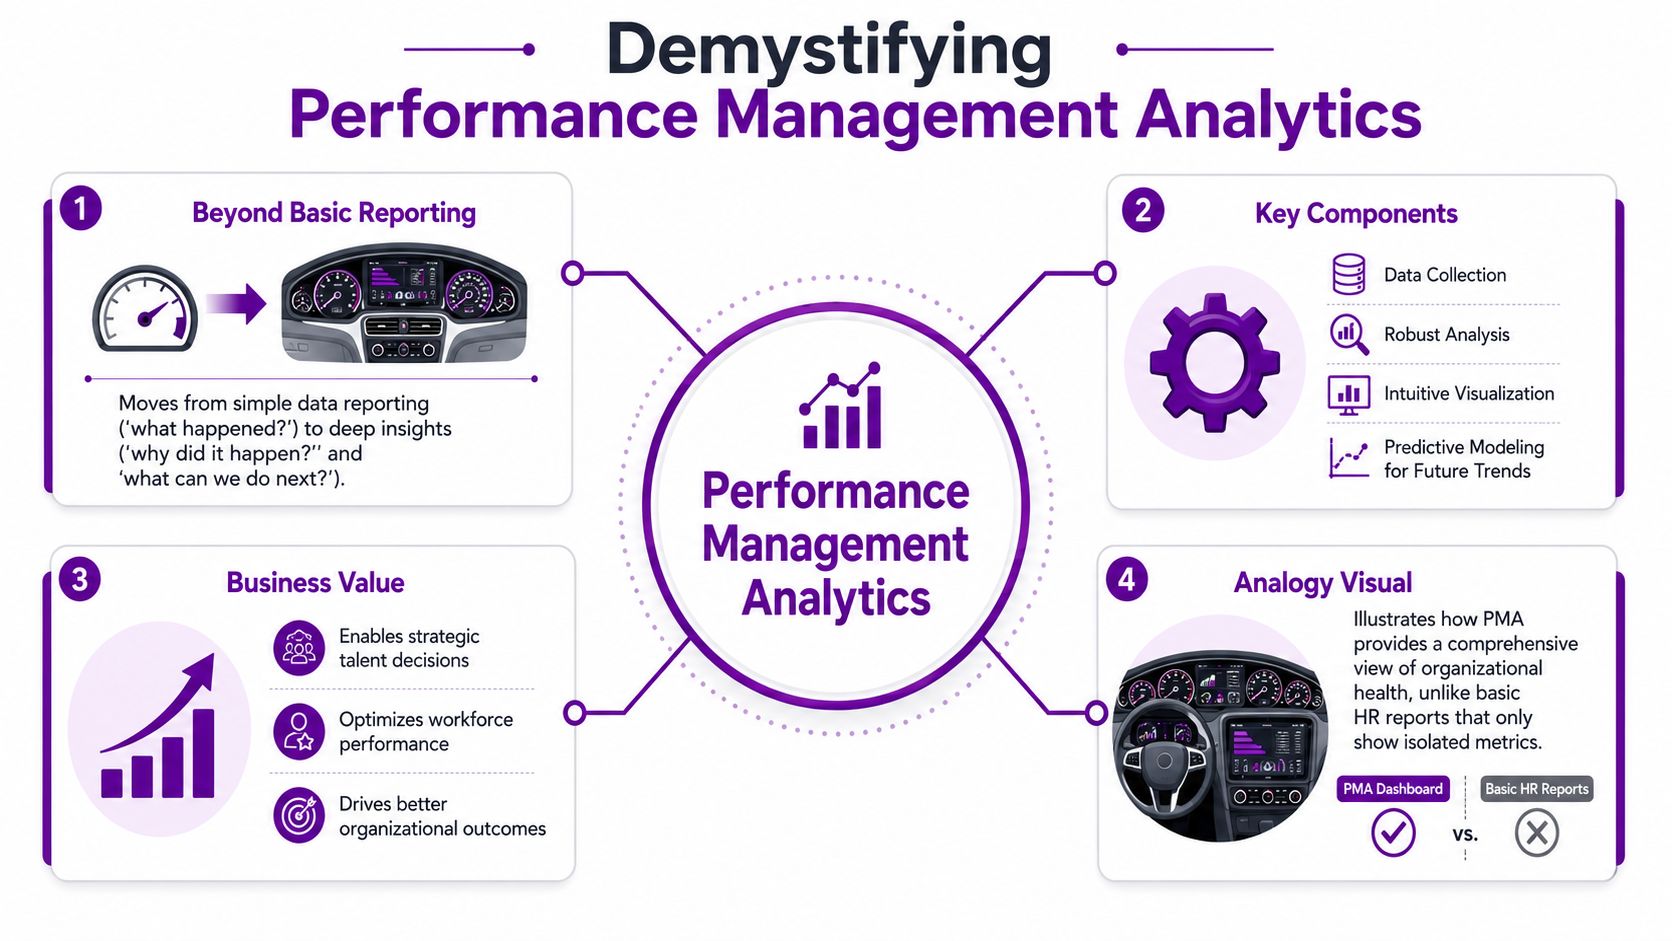
Reporting tells you the score
Most organisations already have some performance data. They know whether reviews were submitted, whether ratings exist, and whether forms were signed off. That's operational reporting. It has value, but it rarely helps someone make a better decision in the moment.
If a manager has overdue reviews, a report can show that. If one division has lower goal completion than another, a report can show that too. What it can't do by itself is tell you whether those metrics are meaningful, whether they correlate with outcomes, or whether the variance reflects bias, weak management, unrealistic targets, or poor data capture.
Analytics asks whether the metric is useful
That distinction matters because a lot of performance programmes collect numbers that don't improve decisions. One of the hardest questions in this space is whether analytics is improving decisions or creating measurement noise. As noted in this discussion on validating decision-useful metrics, effective systems combine behavioural, survey, and HRIS data before a metric is operationalised.
That principle is worth applying rigorously.
Practical rule: if a metric can't help a manager coach, help HR intervene, or help leadership allocate support more fairly, it probably shouldn't sit on the main dashboard.
What strong performance management analytics looks like
A useful model usually does three things well:
-
It combines signals
Goals, feedback entries, review records, employee data, and sentiment indicators sit together rather than in separate systems. -
It highlights exceptions
Average scores rarely tell the full story. The valuable insight is often in the outlier manager, team, or process step. -
It drives action
A dashboard should lead to a specific question or intervention. Who needs coaching? Which team needs calibration? Where is review quality falling?
Done properly, performance management analytics helps organisations reduce bias, strengthen coaching, and align people decisions with business outcomes. Done badly, it floods HR with attractive charts that don't change behaviour. The difference is rarely the visual layer. It's the quality of the model underneath.
Essential HR KPIs and Their Data Sources
The strongest performance analytics programmes don't start with dozens of measures. They start with a small set of KPIs that people can trust and act on. In practice, that means choosing measures that connect behaviour, outcomes, and management quality rather than vanity metrics.
For UK mid-market firms, mechanical scoring is especially important. UK government-backed research shows that mechanical methods of scoring KPIs yield a 22% higher correlation with objective performance outcomes compared to subjective judgement, which suffers from 35% higher rater bias. Organisations using this approach also see 18% faster talent identification cycles. That's the evidence base for weighting defined inputs instead of relying on broad managerial impression.
Which KPIs are worth tracking
Mechanical scoring works best when each metric has a clear source and a clear reason for existing. The table below shows the categories that usually produce the most practical value.
| KPI Category | Example Metric | Primary Data Source |
|---|---|---|
| Goal execution | Goal completion rate | Performance module in HRIS / Dataverse |
| Feedback activity | Feedback frequency by manager | Review and feedback records in Dynamics 365 |
| Review process quality | On-time review completion and comment depth | Performance workflow records |
| Development follow-through | Development plan completion | Learning or development records |
| Talent risk | High-performer flight risk indicators | Combined HRIS, survey, and manager input |
| Calibration fairness | Rating distribution by team or manager | Performance review data |
| Engagement context | Engagement score by factor | Employee survey platform linked to Dataverse |
| DEI oversight | Performance review scores by gender or other demographics | HR master data with consent-controlled demographic fields |
Many teams often get stuck here. They collect a rating, maybe a completion date, and stop there. That creates reporting, not insight.
What works and what usually fails
Good KPI design follows a simple test. Can the organisation explain what the metric means, where it came from, and what action it should trigger? If the answer is vague, the measure won't survive scrutiny from HR, managers, employees, or auditors.
A few patterns tend to work well:
- Weighted scorecards for combining goal progress, feedback cadence, and development actions
- Threshold alerts for obvious risk states, such as low goal completion or repeated absence of check-ins
- Segmented views by team, function, and manager, because averages often hide the underlying issue
A few patterns usually fail:
- Single overall ratings with no supporting metrics
- Activity-only dashboards that reward form completion over management quality
- Metrics with no intervention path, where no one knows what to do next
Teams that care about making a measurable difference usually make the same shift. They stop asking for more metrics and start asking which metrics improve a decision.
For organisations building out a broader reporting model, this guide to human resources analytics is a useful companion because it places performance metrics in the wider HR data context.
If a score can't be traced back to a defined record in the source system, don't use it for talent decisions.
Why Dataverse matters here
Even the best KPI list collapses if the data sits across disconnected tools with inconsistent definitions. Dataverse solves a practical problem. It gives HR and IT a common data model, consistent security, and a clearer path into Power BI.
That matters because performance management analytics depends on trust. Trust in the metric, trust in the source, and trust that the number means the same thing across the organisation.
Architecting Analytics on the Microsoft Stack
Most Microsoft 365 organisations don't need a complicated architecture to start doing this well. They need a sensible one. The most effective designs capture performance activity where work happens, standardise it in Dataverse, and expose it in Power BI with proper security and role-based access.
The key is to think in layers rather than tools.
Capture the data once
Performance data is most reliable when it's recorded as part of the actual process. A manager completes a check-in. An employee updates a goal. HR launches a review cycle. A development action is assigned. Those records should be created inside the operational platform, not retrospectively assembled in a spreadsheet.
In Microsoft environments, that usually means the process layer sits in Dynamics 365 and the data lands in Dataverse. That approach has practical advantages:
- Consistent entities for employees, managers, goals, reviews, and feedback
- Role-based security aligned to Microsoft identity controls
- Cleaner integrations with Teams, Outlook, SharePoint, and Power BI
- Auditability that matters for governance and employee trust
Model for action, not just storage
Once the records are in Dataverse, the next job is to shape them into something decision-ready. That's where many projects go wrong. They load data correctly but don't model it for business use.
A useful semantic model in Power BI should answer role-specific questions. A line manager needs a different view from an HR director. An IT leader needs confidence in refresh, access, and lineage. A compliance lead wants to know who can see demographic segmentation and under what basis.
The Microsoft Power Platform earns its place. It isn't only a reporting toolset. It's the environment that lets organisations connect process, data, automation, and visualisation without stitching together a fragile stack of third-party products.
A practical flow for UK firms
A workable implementation path often looks like this:
-
Define the core records
Decide which performance objects matter first. Usually goals, feedback, review forms, employee master data, and development actions. -
Standardise the fields
Align rating scales, review statuses, ownership, timestamps, and manager relationships. -
Create business logic
Build weighted KPIs, risk flags, and exception rules in a controlled model. -
Publish role-based dashboards
Give managers coaching views, HR oversight views, and executive summary views. -
Add governance controls
Restrict sensitive segmentation, log access, and document how metrics are derived.
Architecture decisions affect trust. If HR can't explain where a metric came from, the dashboard won't survive first contact with managers.
The technical pattern doesn't need to be flashy. It needs to be stable, understandable, and easy to maintain inside the Microsoft estate you already own.
Real-World Examples of Actionable Dashboards
The difference between a useful dashboard and a decorative one is simple. A useful dashboard changes what someone does this week.
That's why performance management analytics should be designed by role. A line manager needs prompts for action. An HR director needs patterns and exceptions across the organisation.

The team pulse dashboard for managers
A manager dashboard should feel operational, not corporate. It needs to answer immediate questions without forcing the user into HR terminology or analytical complexity.
A strong layout usually includes:
- Goal status across direct reports, with at-risk indicators
- Upcoming review deadlines and overdue actions
- Feedback balance, including whether commentary is mostly corrective or mostly positive
- Development actions agreed versus completed
- Engagement context where that data is available and appropriately governed
The point isn't to judge the manager publicly. It's to help them coach sooner. If one employee has low goal progress and no recent feedback, that's a management prompt. If an entire team has sparse check-ins, that's a different intervention.
The strategic HR dashboard for leadership
HR leaders need a broader lens. They're looking for concentration of risk, uneven management practice, and signs that process design is producing unfair or weak outcomes.
A strategic dashboard often brings together:
| Audience | Dashboard Focus | Example Use |
|---|---|---|
| HR Director | Review quality by department | Spot low-quality completion patterns |
| People Partner | Rating distribution by manager | Trigger calibration conversations |
| Leadership team | Goal attainment by function | Identify structural blockers |
| DEI lead | Segmented performance outcomes | Investigate potential bias patterns |
Good visual design is essential. Power BI should make comparison easy without encouraging snap judgement. Heatmaps, trend views, and exception flags tend to work better than crowded scorecards full of unrelated widgets.
The best dashboard is the one that leads to a conversation, not the one with the most tabs.
Later in the process, video walkthroughs can help non-technical stakeholders understand how these views should be used in practice:
Where business value actually appears
The strongest value rarely comes from the dashboard itself. It comes from the operational changes that follow. Managers intervene earlier. HR calibrates more effectively. Leaders stop treating average scores as evidence of fairness.
That's also why I'd avoid weak ROI storytelling. If a team can't link a dashboard to an action path, any financial estimate is speculative. In practice, value usually shows up in better retention decisions, more consistent coaching, stronger succession visibility, and fewer disputes over how ratings were reached.
UK Best Practices for Governance and Compliance
In the UK, performance analytics succeeds or fails on trust. Technology matters, but governance decides whether the programme lasts. If employees think the system is opaque, intrusive, or unfair, adoption drops fast and every dashboard becomes politically expensive.
That risk is sharper in hybrid work. The ONS reported that 28% of working adults were hybrid working in early 2024, which means a lot of performance is inferred from digital activity rather than direct observation. The UK ICO position is equally important. Employers must be transparent about monitoring and assess necessity and proportionality, as discussed in this UK-focused analysis of performance management in hybrid work.
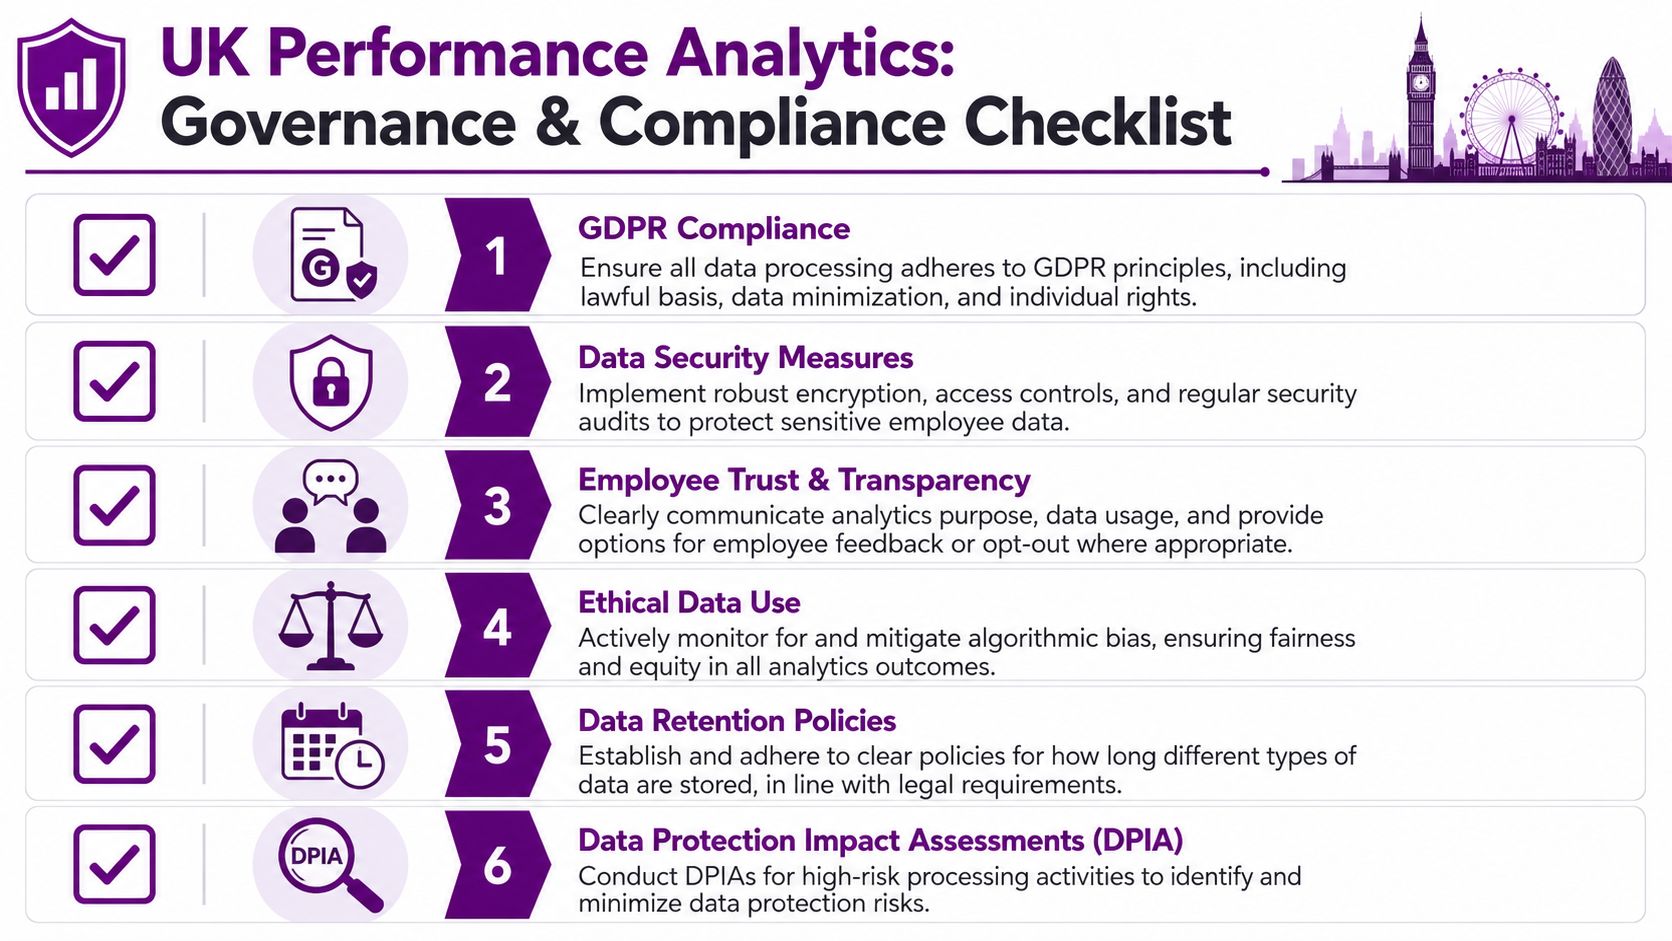
What UK organisations should do first
The first rule is to separate performance evidence from digital exhaust. Just because Microsoft 365 can produce activity data doesn't mean every signal is suitable for performance use. Email volume, message frequency, or document edits can be misleading if taken out of context.
A better compliance-first approach includes:
- Purpose limitation so each metric has a clear and documented reason for use
- Data minimisation so teams only collect what they need
- Access controls so sensitive views are restricted by role
- Audit trails so employees and HR can understand how metrics were derived
- Review governance so high-stakes decisions aren't made from black-box logic
For organisations formalising this work, a practical GDPR compliance checklist helps structure governance decisions before dashboards go live.
DEI and employee trust must sit together
DEI segmentation is where governance becomes very real. If organisations want to detect systemic bias, they need segmented analytics. But they also need explicit controls around consent, access, security, and communication.
The right approach is careful, not timid. Use demographic segmentation where lawful and justified. Restrict who can access it. Explain why it exists. Avoid using sensitive categories as a shortcut for ranking individuals. Focus on identifying patterns that suggest review bias, uneven feedback quality, or promotion imbalance.
Change management matters as much as GDPR
Many projects fail because leaders present analytics as oversight rather than support. Employees hear “monitoring”. Managers hear “surveillance”. HR hears “another reporting burden”.
That framing is avoidable.
Tell employees what the system measures, what it does not measure, who can see the data, and how it will be used in development conversations.
When organisations explain the purpose clearly, keep metrics proportionate, and show visible fairness controls, performance management analytics feels like a management improvement. Without that, it feels like a compliance problem waiting to happen.
Your Next Steps in HR Transformation
Performance management analytics succeeds when people trust the process enough to use it. For UK mid-market firms, that usually comes down to three things: clean source data, measures that support better decisions, and governance that stands up to GDPR scrutiny and employee questions.
The practical route is usually the Microsoft stack you already own. Dataverse gives HR and IT a controlled data layer. Dynamics 365 supports the workflow around reviews, objectives, feedback, and approvals. Power BI turns that operational data into dashboards managers can act on without asking HR to build another spreadsheet.
For hybrid teams, trust matters as much as reporting. Employees need to understand what is being measured, why it is being measured, and how fairness is protected. That matters for DEI work in particular. Segmentation should be planned carefully, access should be restricted, and the purpose should stay focused on pattern detection and better management decisions, not individual labelling.
Start small.
A sensible first phase is a limited KPI set, reliable source mapping, and role-based dashboards for HR, line managers, and leadership. Then test whether the outputs improve coaching quality, calibration, and follow-through in performance conversations. If they do, scale the model across more teams and processes.
Organisations that handle this well build a performance process that is more consistent, more transparent, and easier to defend than an annual review cycle. If you need a partner to guide that work on the Microsoft stack, we can help.
DynamicsHub works with UK organisations that want a practical route to performance management analytics using Dataverse, Power BI, and GDPR-aware governance. We help teams design the data model, configure the process, build reporting that managers will use, and manage rollout in a way that supports employee trust. If that is your next step, contact DynamicsHub. Phone 01522 508096 or send us a message.