Most advice on how to calculate your hourly rate starts in the wrong place. It tells you to take salary, divide by hours, and call it done. That’s fine if you only want a rough reference point. It fails if you need a figure you can use for pricing, budgeting, compliance, or project control in a UK business.
In practice, there isn’t one hourly rate. There are several, and each answers a different question. Payroll needs one number. Finance needs another. Operations often needs a third. If those figures get mixed together, margins erode and managers make decisions using the wrong baseline.
For UK organisations running on Microsoft 365, Dynamics 365, and the Power Platform, this matters even more. Once time, leave, payroll inputs, utilisation, and project costs sit in connected systems, a bad hourly-rate method doesn’t stay isolated in a spreadsheet. It spreads into reporting, forecasting, and charge-out decisions.
Why Your Hourly Rate Calculation Is Probably Wrong
The most common mistake is using a generic full-time hours model imported from US advice. In the UK, the standard salary-to-hourly method uses 52 weeks and a 37.5-hour working week, giving 1,950 hours a year. That means a £50,000 salary converts to £25.64 per hour, not £24.04 using a 2,080-hour model. That gap is a 6.7% error, and it affects budgeting immediately, as shown in this UK salary to hourly calculation reference.

That’s only the first problem. Even if you use the right UK divisor, salary division still doesn’t tell you what that person really costs the employer or what you should charge a client for their time.
Three hourly rates that people confuse
Most firms need to distinguish between these figures:
- Gross hourly wage. This is the employee pay view. It’s usually annual salary divided by standard hours.
- True employer hourly cost. This adds employment on-costs such as employer National Insurance, pension, and other direct labour costs.
- Billable hourly rate. This is the client-facing rate. It must cover total cost, overhead allocation, and a profit margin.
If you use the first number where you should use the third, you underprice. If you use the third where you should use the first, you distort pay benchmarking. If you use neither consistently, your reporting becomes noise.
Practical rule: Ask what decision the number is for before you calculate it. Pay comparison, internal costing, and external pricing are not the same exercise.
Why simplistic advice keeps failing
The usual spreadsheet shortcut ignores at least one of these realities:
- Paid time isn’t the same as productive time. Annual salary covers holidays, sickness, meetings, admin, and training.
- Employer costs sit on top of salary. Finance feels them even if line managers don’t.
- Client work rarely fills every paid hour. Travel, handovers, internal support, and sales activity reduce utilisation.
That’s why many managers think their rate is healthy, then discover a project that looks busy but doesn’t make money.
A better approach starts with a clean distinction between wage, cost, and charge-out rate. If you work in contracting or contingent staffing, a guide to UK contractor earnings can also help you compare how day-rate thinking differs from salaried cost modelling.
Calculating the True Cost of an Employee Beyond Salary
Dividing salary by hours gives you a wage figure. It does not give you the cost of employing someone in the UK.
That gap matters. I see mid-market firms price work off a clean-looking hourly figure, then spend months wondering why project margin is weaker than expected. The problem usually starts here, with labour cost treated as salary alone and everything else pushed into the background.
Start with gross salary, then build the real employment cost
Use annual gross salary as the baseline. From there, add the employer costs that sit directly against that person.
For a UK employee, that usually includes:
- Employer National Insurance
- Employer pension contributions
- Contractual benefits paid per employee
- Paid annual leave and bank holidays
- Any fixed allowances or role-specific employment costs
The point is simple. If the business must pay it because that person is employed, it belongs in the direct employment cost model.
Paid time and usable time are different numbers
One of the biggest costing errors is treating every paid hour as available for delivery. It is not.
Employees are paid through holiday, bank holidays, sickness absence, training, internal meetings, appraisals, and compliance activity. In UK operations, that distinction matters even more because statutory leave is built into the cost base from day one. Salary already includes that paid time, but your productive capacity does not.
This is why a salary-only hourly figure often looks acceptable in payroll discussions and fails in project costing.
What should sit in direct labour cost
Keep this stage tight. The aim is to calculate what the employee costs before any share of rent, software, management, or wider business support is applied.
A practical model looks like this:
- Annual gross salary
- Plus employer NI
- Plus employer pension
- Plus fixed employee-specific costs
- Equals direct annual employment cost
Then convert that annual figure into an internal hourly cost using a hours base that matches the decision you are making. For pay benchmarking, standard annual hours may be fine. For delivery forecasting or client pricing, available working hours are usually the better base.
That distinction is where many finance and HR teams start to disagree. Finance wants a recoverable cost. HR often starts with contractual hours. Both numbers can be valid, but they should not be used interchangeably.
Leave is not overhead
I often see holiday pay treated as if it belongs in a later adjustment. It does not. It sits inside the direct cost of employment because the business is paying for time that cannot all be sold or assigned to productive output.
That is why firms using a flat salary-divided-by-hours approach usually understate labour cost before they have even touched overhead allocation or profit margin.
Keep the calculation auditable
If you are running this in spreadsheets across departments, version control becomes a problem quickly. One team updates pension assumptions, another forgets employer NI thresholds, and project managers keep using an outdated hours base. The result is inconsistent pricing and weak margin reporting.
A better approach is to standardise the inputs and logic in one place. This employee cost calculator for UK labour costing is a useful starting point if you want a clearer method before building rates into your finance and project systems.
For firms already using Microsoft tools, I would usually push this model into Dynamics 365 and expose the key assumptions through Power Platform. That gives HR, finance, and operations one agreed cost basis, with rate changes tracked properly instead of being buried in separate files.
What to avoid
- Using take-home pay or net pay. Internal costing starts from gross employer cost.
- Leaving pension out because it is a small percentage. Across a team, it is not small.
- Assuming holiday is already dealt with because it sits inside salary. That misses the capacity impact.
- Mixing payroll hours with billable availability. They answer different questions.
Get this layer right first. If the direct employment cost is wrong, every utilisation, pricing, and profitability number built on top of it is wrong as well.
Allocating Overheads and Realistic Utilisation Rates
Plenty of firms stop the calculation too early. They work out salary cost, divide by annual hours, and call that an hourly rate. That figure is usually too low to price work safely because it ignores two things that drive margin in real life: shared business costs and the fact that salaried staff are not billable for every paid hour.
What counts as overhead
Overheads sit outside an individual payslip but still have to be recovered through chargeable work.
In UK mid-market firms, that usually includes property costs, Microsoft 365 and other business systems, cyber security, vehicles, mobile phones, professional indemnity insurance, finance and HR support, line management, quality assurance, compliance activity, and bid or sales support. If a cost exists because the business operates, and you cannot assign it cleanly to one employee or one job, it belongs in the overhead pool.
The allocation method matters. A flat per-head charge is simple and often good enough for office-based teams with similar cost profiles. It breaks down quickly where some roles carry vehicles, specialist software licences, field equipment, or heavy management support. In those cases, I usually split overheads by service line or cost centre first, then by headcount or labour hours inside each group. That avoids a common distortion where lower-cost teams subsidise the expensive ones.
Paid hours are not billable hours
The annual salary divisor helps convert salary into an hourly equivalent. It does not tell you what one chargeable hour needs to recover.
For pricing, the central question is capacity. Start with paid hours. Then remove annual leave, bank holidays if they are not worked, sickness assumptions, training, internal meetings, supervision, business development support, and the admin that keeps delivery compliant. Travel is another judgement call. In some sectors it is recoverable. In others it is a dead cost against utilisation.
A firm may pay someone for a full working year and still only have a fraction of those hours available to bill.
That is why utilisation rates need to be evidence-based. Timesheets, project data, service activity, and absence records will usually show a lower billable percentage than line managers expect. The point is not to produce a pessimistic number. It is to stop pricing from being built on wishful thinking.
A practical utilisation test
Use four separate figures, not one blended assumption:
- Paid hours. Contracted annual hours.
- Available hours. Paid hours less leave and expected absence.
- productive hours. Available hours less internal admin, training, management time, and non-client support.
- Billable hours. Hours that can be charged or recovered under your delivery model.
That discipline also improves workforce planning. If you are aligning rates with resource forecasts, this guide on how to calculate FTE is useful for translating headcount into realistic available capacity.
Common modelling mistakes
Weak hourly rate models usually fail in familiar ways:
- Overheads are spread too loosely. Core support costs sit in finance reports but never reach pricing.
- Utilisation is set by target, not history. A team is told to hit 85%, so the calculator assumes 85%.
- Non-billable delivery support is ignored. Technical reviews, rework, compliance checks, and customer issue resolution disappear from the model.
- Every role is benchmarked the same way. Senior consultants, coordinators, and field engineers do not consume overhead in the same pattern.
- Salary benchmarks replace cost and utilisation analysis. External pay data is helpful for sense-checking grade levels and regional pay pressure, and data-driven UK salary insights can support that step, but they do not tell you what your business must recover per chargeable hour.
Build the model where people can trust it
Spreadsheets begin to struggle. Finance owns overheads, HR owns working patterns, operations owns utilisation assumptions, and project teams hold the live delivery data. If those inputs sit in different files, rate reviews become slow and arguments about whose numbers are right become routine.
Dynamics 365 gives you a cleaner setup. Finance can hold cost centres and overhead pools in Business Central or Finance. HR data can flow in through Dataverse or Power Platform. Project Operations or Field Service can supply actual time categories, recoverability, and utilisation by role or team. Once that structure is in place, rate calculations become repeatable, auditable, and easier to defend in front of directors.
The number that matters is simple:
- direct employment cost,
- plus allocated overhead,
- divided by realistic billable hours.
That is your breakeven hourly rate before profit.
Setting Your Final Billable Rate with a Profit Margin
Once you’ve established your breakeven rate, pricing becomes a commercial choice rather than a guess. That’s where many firms improve overnight. They stop asking, “What do others charge?” and start asking, “What must this work return to be viable?”
Market awareness still matters. Salary benchmarks can help with the underlying labour assumptions, and data-driven UK salary insights are useful for sense-checking role levels by geography and function. But benchmarking should inform your rate, not replace your calculation.
Cost-plus is the floor, not the whole strategy
The cleanest starting point is cost-plus pricing:
- calculate true annual cost,
- divide by realistic billable hours,
- add a target profit margin.
That gives you a defensible rate. It won’t answer every commercial question, but it prevents the worst error, which is selling work below a sustainable threshold without realising it.
Worked example for a UK field service engineer
For field service, the arithmetic is unusually visible because travel, vehicles, and utilisation have such a strong impact. A practical UK benchmark shows that a £35,000 salary engineer can produce a total annual cost of £58,380, with a breakeven rate of about £45.83 per hour based on 1,273 billable hours, and a final billable rate of £57.29 per hour, commonly rounded to £55 to £60 per hour outside London, according to this UK field service hourly rate method.
Here is that example laid out clearly.
| Cost Component | Calculation | Annual Cost (£) |
|---|---|---|
| Base salary | Fixed annual salary | 35,000 |
| Employer NI | 13.8% of salary | 4,830 |
| Employer pension | 3% of salary | 1,050 |
| True wage cost | Salary + NI + pension | 40,880 |
| Van and fuel | Depreciation, fuel, insurance and maintenance | 7,500 |
| Overheads | Office, software and marketing | 10,000 |
| Total annual cost | Labour + vehicle + overheads | 58,380 |
With that total cost established, the next step is hours. The model uses 1,273 billable hours a year, based on realistic utilisation rather than full paid time. Divide £58,380 by 1,273 and you get a breakeven rate of about £45.83 per hour. Apply a 20% margin, and the charge-out rate becomes about £57.29 per hour.
Why this example matters
This isn’t just a field service issue. The same pattern shows up in HR consulting, software implementation, engineering support, and managed services.
What works:
- Pricing from total cost upward
- Using realistic billable hours
- Setting margin deliberately instead of “adding a bit on top”
- Rounding the final number into a market-usable rate
What doesn’t:
- Dividing salary by full-time paid hours and calling that charge-out
- Ignoring role-specific operating costs such as vehicles or licences
- Assuming every engineer or consultant has the same utilisation profile
A profitable rate should survive normal delivery friction. If one late start, one recall visit, or one extra internal meeting destroys margin, the rate was too low to begin with.
Cost-plus and value together
Some leaders worry that cost-plus sounds too mechanical. It isn’t, if you use it properly. Cost-plus gives you a floor. Value, scarcity, response time, and complexity shape what sits above that floor.
A specialist carrying compliance risk, difficult integrations, or urgent field response may justify a higher rate than a standard service task. The key is to know the minimum viable rate before making that commercial judgement.
Automate and Report Rates with Dynamics 365 and Power Platform
Manual hourly-rate models usually fail for one reason. The underlying data is scattered. Salary sits in payroll. Leave sits in one system. Timesheets sit somewhere else. Project reporting arrives late. By the time finance rebuilds the numbers, the month has moved on.
That’s why hourly-rate control becomes much more practical when the data lives in one Microsoft environment. For organisations already using Microsoft 365, the combination of Dynamics 365, Dataverse, Power Platform, Teams, Outlook, SharePoint, and Power BI gives you the structure needed to stop recalculating the same figures by hand.

Where automation actually helps
In practice, rate accuracy depends on three things being trustworthy:
- People data such as salary, role, location, and employment status
- Time data including attendance, leave, and actual hours worked
- Cost logic for overhead allocation, utilisation rules, and margin settings
When those inputs are disconnected, managers compensate with assumptions. When they are connected, hourly-rate reporting becomes repeatable.
Hubdrive’s HR Management for Microsoft Dynamics 365 is designed around this kind of connected model. Built natively on Dataverse, it supports hire-to-retire processes and sits naturally alongside the rest of the Microsoft stack. Product materials describe capabilities across recruiting, onboarding, performance, time and attendance, expenses, and compliance, with data held in the customer’s own tenant and secured through Microsoft controls such as Entra ID.
Time capture is the turning point
The biggest shift comes when actual hours are captured reliably. Time and attendance tools matter because every hourly-rate formula depends on sound hours data. If your clocking, leave, and absence records are weak, every downstream cost model is weak too.
For some mid-market employers, that means straightforward digital timesheets. For others, especially operational teams, it means attendance tools with stronger controls, including options such as AI facial-recognition clocking where appropriate to the process design.
What Power BI should show
A useful dashboard doesn’t just display timesheet totals. It should answer management questions quickly.
Good reporting usually includes:
- True hourly employer cost by role or team
- Charge-out rate versus breakeven rate
- Utilisation by department or service line
- Project profitability trends
- Exceptions where actual hours change compliance or pricing assumptions
For consulting teams, there is a strong benchmark for this kind of approach. A UK HR consultancy example shows total consultant cost at around £95,080, a breakeven of £75.46 per hour based on 1,260 billable hours, and a final charge rate of about £95 per hour after a 25% margin. The same reference notes 15% optimisation through Power BI tracking, within a broader £80 to £120 per hour billable range, as outlined in this billable hourly rate method for consultancies.
That’s the true value of automation. Not prettier dashboards. Better decisions made earlier.
Operational view: If HR, finance, and service operations each report a different hourly rate for the same person, the business hasn’t got a pricing problem. It has a data model problem.
Why this matters for Microsoft-centric firms
For organisations standardised on Microsoft, the advantage is less about adding another tool and more about reducing duplication. Dataverse gives a shared data layer. Power Apps supports process capture. Power Automate handles movement between steps. Power BI turns the resulting data into something leadership can use.
If you’re assessing how a connected HR and workforce model fits into your wider stack, this Dynamics 365 HR overview provides a useful reference point.
Take Control of Your Profitability and Compliance
If you want to know how to calculate your hourly rate properly, start by dropping the idea that one formula fits every purpose. Salary conversion is one task. Employer cost is another. Client pricing is a third.
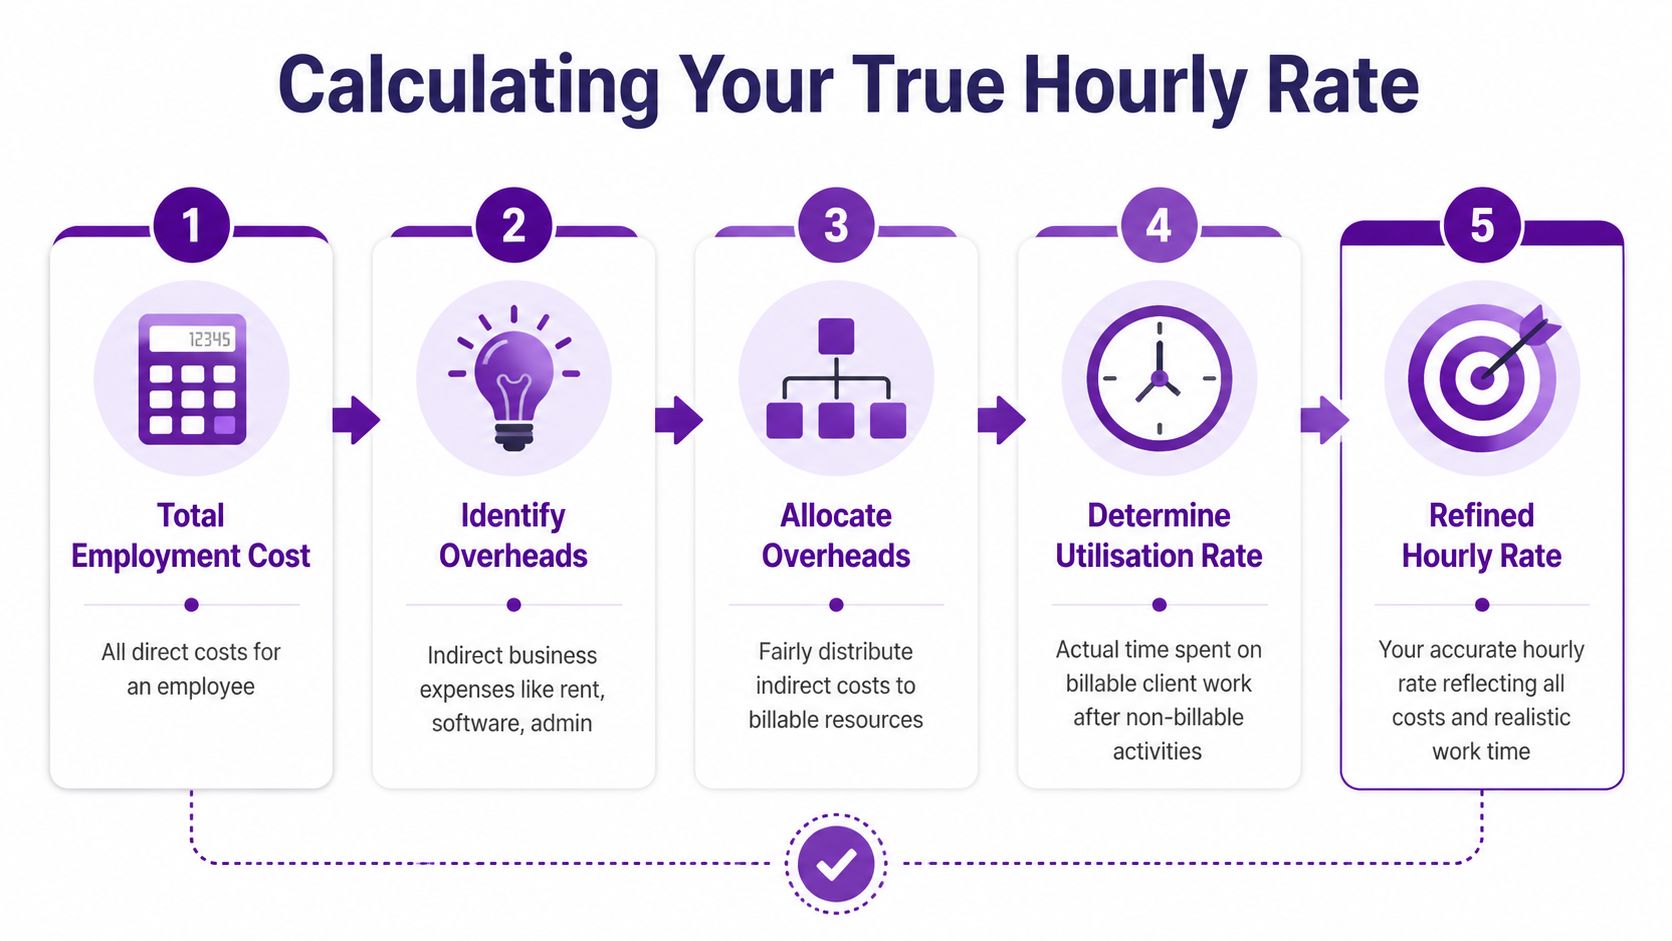
The reliable method is straightforward. Calculate direct employment cost first. Add fair overhead allocation next. Reduce annual hours to realistic usable or billable time. Then apply a margin that fits the work and the risk.
That approach improves more than pricing. It sharpens budgeting, strengthens project forecasting, and reduces compliance exposure where actual hours matter. It also gives HR, finance, and operations one shared basis for decision-making instead of three competing spreadsheets.
We are DynamicsHub.co.uk. Experience HR transformation built around your business. Hubdrive’s HR Management for Microsoft Dynamics 365 is the premier hire‑to‑retire solution, more powerful, more flexible, and more future‑ready than Microsoft Dynamics 365 HR.
DynamicsHub helps UK organisations turn fragmented HR, time, attendance, and operational data into practical reporting inside Microsoft’s ecosystem. If you want a clearer view of labour cost, utilisation, and charge-out rates, speak to DynamicsHub today. Phone 01522 508096 or send us a message.