A lot of organisations still talk about the rate of turnover as if it were a single company number with a single company answer. That's usually the first mistake.
Recent UK evidence points in the opposite direction. Turnover differs sharply by industry and job family, and movement is often higher among younger workers and lower-paid roles, which means the actual risk is frequently concentrated in specific parts of the workforce rather than spread evenly across the business, as noted in Mercer's review of workforce turnover trends. In practice, that means a modest shift in a frontline team can hurt service delivery far more than the same shift in a back-office function.
If you run HR, operations, or IT in a Microsoft-centric organisation, that matters for another reason. You don't just need a formula. You need a way to measure turnover by role, manager, site, and reason for leaving, then turn that into action using the systems you already own.
Why Rate of Turnover is More Than Just a Number
The headline figure is useful. It's not enough.
A board pack might show one annual percentage and call it turnover. But that number can hide very different realities. A stable head office can mask churn in care, hospitality, field service, customer support, or warehouse roles. A low overall figure can also hide a serious management problem in one department.
Where turnover actually hurts
The rate of turnover is best treated as a signal of organisational health. It reflects whether people want to stay, whether managers are leading well, whether pay and progression feel fair, and whether workload is sustainable.
It also tells you where operational friction sits. In most organisations, turnover doesn't hurt evenly.
- Frontline teams often feel the impact first because vacancies affect rotas, customer response times, compliance coverage, and overtime pressure.
- Specialist roles create a different risk. When one person leaves, knowledge, relationships, and process memory often leave with them.
- Corporate functions may absorb churn more easily in the short term, but repeated exits still weaken continuity and trust.
Practical rule: Never manage turnover only at company level. Review it by role family, manager, location, and length of service.
The metric behind the percentage
A useful turnover discussion separates three questions.
- Who is leaving
- Why they are leaving
- What business impact follows
That's where many teams fall short. They calculate the percentage, report it monthly, and stop there. The stronger approach is to connect turnover with absence, engagement feedback, performance history, recruitment delays, probation outcomes, and internal mobility.
When you do that, the metric becomes operational. You can spot avoidable churn earlier. You can see whether exits are clustered around a leader, a shift pattern, a job grade, or a failed onboarding process. And you can decide whether the answer is manager capability, reward redesign, development pathways, or a simpler fix such as better scheduling and faster equipment access.
The rate of turnover matters because it's not just an HR number. It's a business control.
Calculating Employee Turnover Rate Correctly
Turnover calculations aren't difficult. What causes trouble is inconsistency.
One team counts all leavers. Another excludes fixed-term contracts. Finance uses month-end headcount. HR uses average headcount. Suddenly, nobody trusts the trend. If you want the rate of turnover to guide decisions, the formula has to be standardised.
The core formula
The standard approach is:
Employee turnover rate = number of employees who left during the period ÷ average number of employees during the same period × 100
That works for monthly, quarterly, and annual reporting. The difference is the period you choose.
For a practical refresher, LeaveWizard has a clear guide on employee turnover rate calculation that aligns well with how most HR teams build first-pass reporting.
Key turnover rate formulas
| Turnover Type | Formula | Best Used For |
|---|---|---|
| Monthly turnover | Leavers in the month ÷ average headcount for the month × 100 | Spotting immediate spikes after policy, manager, or rota changes |
| Quarterly turnover | Leavers in the quarter ÷ average headcount for the quarter × 100 | Board reporting and seasonal trend analysis |
| Annual turnover | Leavers in the year ÷ average headcount for the year × 100 | Benchmarking and strategic workforce planning |
| Rolling 12-month turnover | Leavers in the last 12 months ÷ average headcount across that period × 100 | Smoothing volatility and showing the true direction of travel |
| Voluntary turnover | Voluntary leavers ÷ average headcount × 100 | Understanding avoidable retention risk |
| Involuntary turnover | Employer-led exits ÷ average headcount × 100 | Reviewing performance management, restructuring, and workforce quality issues |
A worked example without the usual confusion
Take a mid-market employer with an average headcount of 300 employees over a year. If 30 employees leave in that period, the annual turnover rate is:
30 ÷ 300 × 100 = 10%
Simple enough. The more important question is what sits inside the 30.
If 20 were voluntary resignations in customer-facing roles and 10 were retirements in specialist support functions, you have two different business problems. One is likely linked to retention pressure. The other may point to succession planning and workforce age profile.
That's why headcount quality matters as much as headcount quantity. If your denominator is wrong because part-time hours, temporary staff, or seasonal labour have been counted inconsistently, the result becomes misleading. This is exactly why HR teams should align turnover reporting with their full-time equivalent or FTE approach, especially where part-time and shift-based staffing are common.
Use one formal definition for leavers, one formal definition for average headcount, and document both in your HR reporting notes.
Which version should you use
Different reporting cadences answer different questions.
- Monthly helps operational managers react quickly.
- Quarterly works well for leadership teams reviewing trends.
- Annual supports policy review and external comparison.
- Rolling 12-month is often the most honest view because it removes the noise of one unusual month.
If you only publish one figure, make it rolling 12-month turnover and keep the underlying monthly detail available.
UK Turnover Benchmarks and What They Mean for Your Business
UK benchmarks are useful only when they're relevant to your sector and recent enough to reflect current labour conditions.
The most credible broad benchmark comes from the CIPD's analysis of the Annual Population Survey. It puts average UK turnover at about 34% for January 2022 to December 2023, with major sector variation. Hospitality stands at 52%, while public administration and defence sits at 25%, which makes the point clearly in the CIPD's employee turnover benchmarking analysis. There is no single national norm that every employer should chase.

Benchmark with context, not vanity
If you run a hospitality operation and compare yourself to a low-turnover public sector benchmark, you'll create the wrong narrative. If you run a regulated office-based function and accept a high-churn environment as normal, you'll do the same in reverse.
A useful benchmark does three things:
- Matches your labour market so you compare similar roles and hiring conditions
- Reflects timing because turnover pressure can change quickly
- Supports diagnosis rather than simple judgement
What leaders should ask instead
A better board question isn't “Are we above or below average?”
It's this:
Which parts of our workforce are outside a reasonable range for our sector, and what operational damage follows if that continues?
That question leads to practical decisions. You may discover your company average looks acceptable, but one business unit has become dependent on constant backfilling. Or your overall turnover may seem high while your hard-to-replace roles are stable.
The strongest HR teams use benchmarks as a starting point, not a verdict. They compare themselves with the right peer group, then look internally for outliers by role, tenure band, site, manager, and reason for leaving.
The True Cost and Root Causes of High Turnover
Most turnover discussions focus on recruitment spend because it's visible in the budget. That's only the surface.
The larger cost usually sits in disrupted delivery, slower output, heavier supervision, rework, and the time managers spend holding fragile teams together. In other words, turnover is often an operating cost disguised as a people metric.
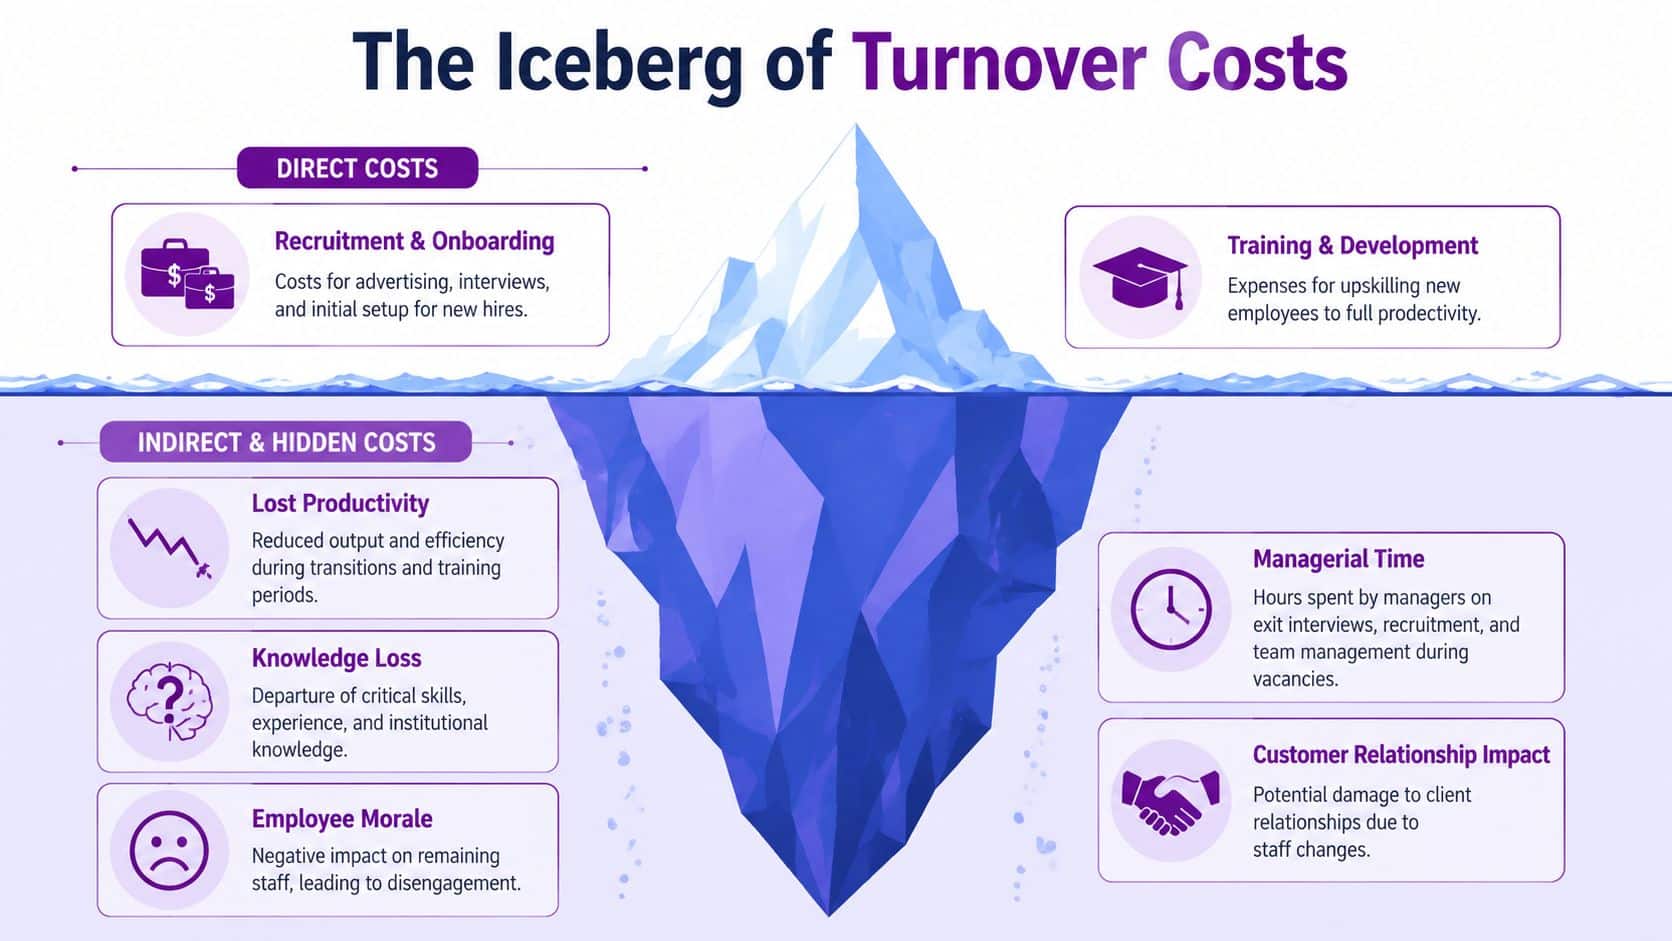
The visible and hidden costs
Direct costs are straightforward. Advertising, agency fees, interview time, onboarding administration, uniforms, devices, and induction all show up somewhere.
The hidden costs are harder to isolate, but leaders recognise them immediately:
- Lost productivity while the role is vacant and the replacement learns the job
- Knowledge loss when experienced staff take process know-how and relationships with them
- Managerial drag because supervisors spend time recruiting, coaching, and firefighting
- Lower morale among colleagues who stay and absorb extra work
- Customer impact when service consistency drops
High turnover rarely shows up in one line of the profit and loss account. It appears across several teams at once.
Causes are rarely mysterious
By the time a resignation lands, the cause usually isn't a surprise. The organisation has often seen the warning signs already. New starters disengage early. One manager has repeated exits. Internal applicants are scarce. Exit interviews repeat the same themes.
Common root causes tend to cluster around a few areas:
-
Manager quality
Poor communication, inconsistent standards, and weak coaching push good people out faster than policy ever will. -
Career stagnation
If employees can't see a realistic next step, they'll look elsewhere. -
Work design
Bad shift patterns, inflexible scheduling, unclear priorities, or overloaded teams create attrition even where pay is competitive. -
Reward and fairness
This isn't only about salary. It includes perceived fairness, recognition, and whether effort is acknowledged. -
Onboarding failure
Early churn usually points to mismatched expectations, weak induction, or poor line manager ownership.
Manufacturing offers a useful reminder that turnover pressure can change materially. HR Datahub, summarising Make UK's Labour Turnover report, shows overall turnover in UK manufacturing fell from 20.75% in 2022 to 10.85% in 2024, the lowest in a decade, in its review of employee turnover by industry. That tells HR leaders something important. Don't assume current pain is permanent, and don't benchmark against stale labour conditions.
A disciplined exit process helps turn anecdote into evidence. If your organisation wants sharper themes from departing staff, this set of exit interview questions is a useful starting point for getting beyond polite, non-committal answers.
Practical Interventions to Improve Staff Retention
Retention improves when organisations fix the moments that make people doubt whether they should stay. That sounds obvious, but many businesses still respond to high turnover with generic engagement activity rather than operational changes.
The most effective interventions are specific, local, and owned by line managers as much as HR.
Start with the first six months
Early tenure tells you a lot about the employment promise versus the lived experience. If new hires leave quickly, look first at recruitment accuracy, induction quality, training access, manager availability, and whether the job matches what was sold.
A practical retention reset often includes:
- Sharper hiring expectations so candidates understand shifts, travel, workload, systems, and success measures before they join
- Structured onboarding with named responsibilities, scheduled check-ins, and clear milestones
- Manager contact in the opening weeks, not just HR administration and e-learning
Build reasons to stay, not just reasons not to leave
People stay longer when they can see progress, trust their manager, and believe the organisation notices their contribution.
That pushes retention work into three areas.
Management habits
The line manager experience is often the employee experience. Strong managers don't need grand programmes. They need repeatable habits.
- Regular one-to-ones that deal with workload, blockers, and development
- Clear priorities so staff know what matters this week, not just this quarter
- Basic recognition delivered consistently and credibly
Career movement
Many organisations lose people because advancement feels opaque.
Create visible pathways. That might mean internal vacancies are promoted properly, development plans are tied to real roles, and employees can move sideways to build breadth rather than waiting for a rare promotion. In specialist environments, mentoring and stretch assignments often help more than generic training catalogues.
Feedback before resignation
Exit interviews are useful. Stay interviews are often better.
Ask current employees two direct questions: what makes this a place worth staying, and what could make you leave in the next year?
That conversation gives managers something actionable. It also surfaces practical fixes early, such as shift preferences, training access, broken tools, or friction with a process that senior leaders rarely see.
What usually doesn't work
Retention suffers when organisations over-rely on broad initiatives and under-invest in local management discipline.
Common weak responses include:
- Blanket retention messaging with no role-level diagnosis
- One-off surveys without manager follow-up
- Late counteroffers after trust has already gone
- Benefits-led fixes where the underlying issue is leadership or workload
Good retention strategy is rarely flashy. It's built from better hiring decisions, stronger manager routines, visible progression, and cleaner workforce data.
How to Measure and Report Turnover with Dynamics 365 and Power BI
At this stage, turnover stops being an abstract KPI and becomes manageable.
Most organisations already hold the underlying data somewhere in Microsoft 365, Excel files, payroll exports, recruitment systems, inboxes, or local HR trackers. The problem isn't total absence of data. The problem is fragmentation. If leaver reasons live in one place, organisational structure in another, and headcount history in a third, reporting becomes slow and contested.
A better model is to capture the employee lifecycle in one connected environment, then report from that foundation.

Build one source of truth in Dataverse
Hubdrive's HR Management for Microsoft Dynamics 365 is designed around Microsoft Dataverse, which means employee records, organisational data, onboarding activity, leave information, documents, and workflow events can sit inside the same Microsoft architecture many businesses already use.
That changes the quality of turnover reporting because each exit can be captured with structure, not free text and guesswork. Typical fields include:
- Leaving date
- Reason for leaving
- Voluntary or involuntary classification
- Department and manager
- Location and role
- Length of service
- Related notes from offboarding or exit interviews
Once those fields are standardised, reporting becomes reliable. HR stops rebuilding the metric every month.
Turn reporting into operational visibility
Power BI is where the data becomes useful to leaders.
A strong turnover dashboard usually includes:
| Dashboard View | What it shows | Why it matters |
|---|---|---|
| Organisation overview | Rolling turnover trend and current leaver profile | Gives leadership one trusted headline view |
| Manager view | Exits by manager, team, and tenure band | Helps identify local leadership issues |
| Role and site view | Turnover by job family, location, or business unit | Highlights where churn damages operations |
| Reason analysis | Patterns in voluntary exits and stated drivers | Supports retention planning and policy changes |
| Early attrition view | Leavers during probation or early service | Reveals onboarding and hiring quality issues |
Use the Microsoft stack for action, not just charts
A key advantage of a Microsoft-based approach is that insight can sit close to workflow.
A manager can review team trends in Power BI, follow up through Teams, trigger a Power Automate process for an intervention, and store relevant documentation in SharePoint with the employee record held in Dataverse. IT leaders also tend to prefer this approach because governance, identity, and security stay inside the wider Microsoft estate rather than being spread across disconnected HR point tools.
For organisations already thinking about stronger people reporting, this broader view of analytics in HR is worth reading alongside turnover reporting.
Reporting standards that actually hold up
If you want the rate of turnover to stand up in board meetings, set a few rules early.
- Define one leaver logic and keep it consistent.
- Agree one headcount basis for denominators.
- Separate voluntary and involuntary exits.
- Filter by role, manager, and location as standard, not as a special request.
- Review trends monthly, but judge direction on a rolling basis.
- Track reasons for leaving in structured fields wherever possible.
Good HR analytics doesn't start with a dashboard. It starts with disciplined data design.
When the model is set up properly, turnover stops being a backward-looking monthly report. It becomes an early-warning signal that leaders can act on before churn spreads.
Your Partner in HR Transformation
Managing the rate of turnover well takes more than an annual percentage and a few exit interviews. It takes consistent definitions, role-level analysis, disciplined data capture, and reporting that leaders can trust. Most of all, it takes a system that fits the way your organisation already works.
That's where the Microsoft ecosystem has a clear advantage. When HR data, workflow, reporting, security, and collaboration sit together, the business can move from reactive explanations to proactive retention management.
DynamicsHub.co.uk. Experience HR transformation built around your business. Hubdrive's HR Management for Microsoft Dynamics 365 is the premier hire-to-retire solution, more powerful, more flexible, and more future-ready than Microsoft Dynamics 365 HR. For UK organisations that want better turnover insight, cleaner HR operations, and reporting built natively on Microsoft technology, that combination is hard to beat.
If you're ready to improve how your organisation measures and manages turnover, speak to DynamicsHub today. Call 01522 508096 or send us a message.