Your HR team probably already has engagement data. The problem is that it's scattered, stale, and too weak to guide action.
One survey sits in Forms. Absence data lives in payroll or a time system. Turnover is tracked in a spreadsheet. Managers add anecdotal comments in meetings, then the board asks a simple question: why are people leaving this team and not that one? Most organisations still answer with opinion dressed up as analysis.
That's not good enough now. If you're a UK HR director or IT leader running Microsoft 365, you already own the foundations of a better model. The right move is to stop treating engagement as a once-a-year survey exercise and start treating it as an operating system built on connected people data.
Why Employee Engagement Metrics Matter Now More Than Ever
The board doesn't care about engagement because it sounds progressive. It cares because engagement shows up in retention, absence, manager effectiveness, internal movement, and delivery risk.
That matters more in a labour market where replacing people isn't easy. The ONS reported the UK unemployment rate at 4.5% for January to March 2025, which means retention and absenteeism are being tracked in a relatively tight labour market where keeping good people matters commercially, not just culturally, as noted in this employee engagement overview.
What basic surveys miss
A single annual score doesn't tell you much. It won't explain whether a drop in sentiment is linked to workload, poor management, weak onboarding, or blocked progression. It definitely won't help a line manager decide what to do next week.
What works better is a joined-up view of employee engagement metrics built from two sources:
- Survey-based signals like eNPS, pulse responses, and participation
- Behavioural signals like voluntary turnover, absence, retention, and internal mobility
When those sit together, patterns appear quickly. If one business unit shows weaker pulse results and higher voluntary exits, you have a problem worth acting on. If another has average sentiment but rising absence, the issue may be workload or wellbeing rather than loyalty.
Engagement becomes useful when it stops being a sentiment score and starts being a management signal.
The shift HR leaders need to make
Stop asking, “What was our engagement score?”
Start asking:
- Where is engagement weakening
- Which managers or teams need attention
- What operational data supports that conclusion
- What action will we take in the next month
That's the difference between reporting and leadership.
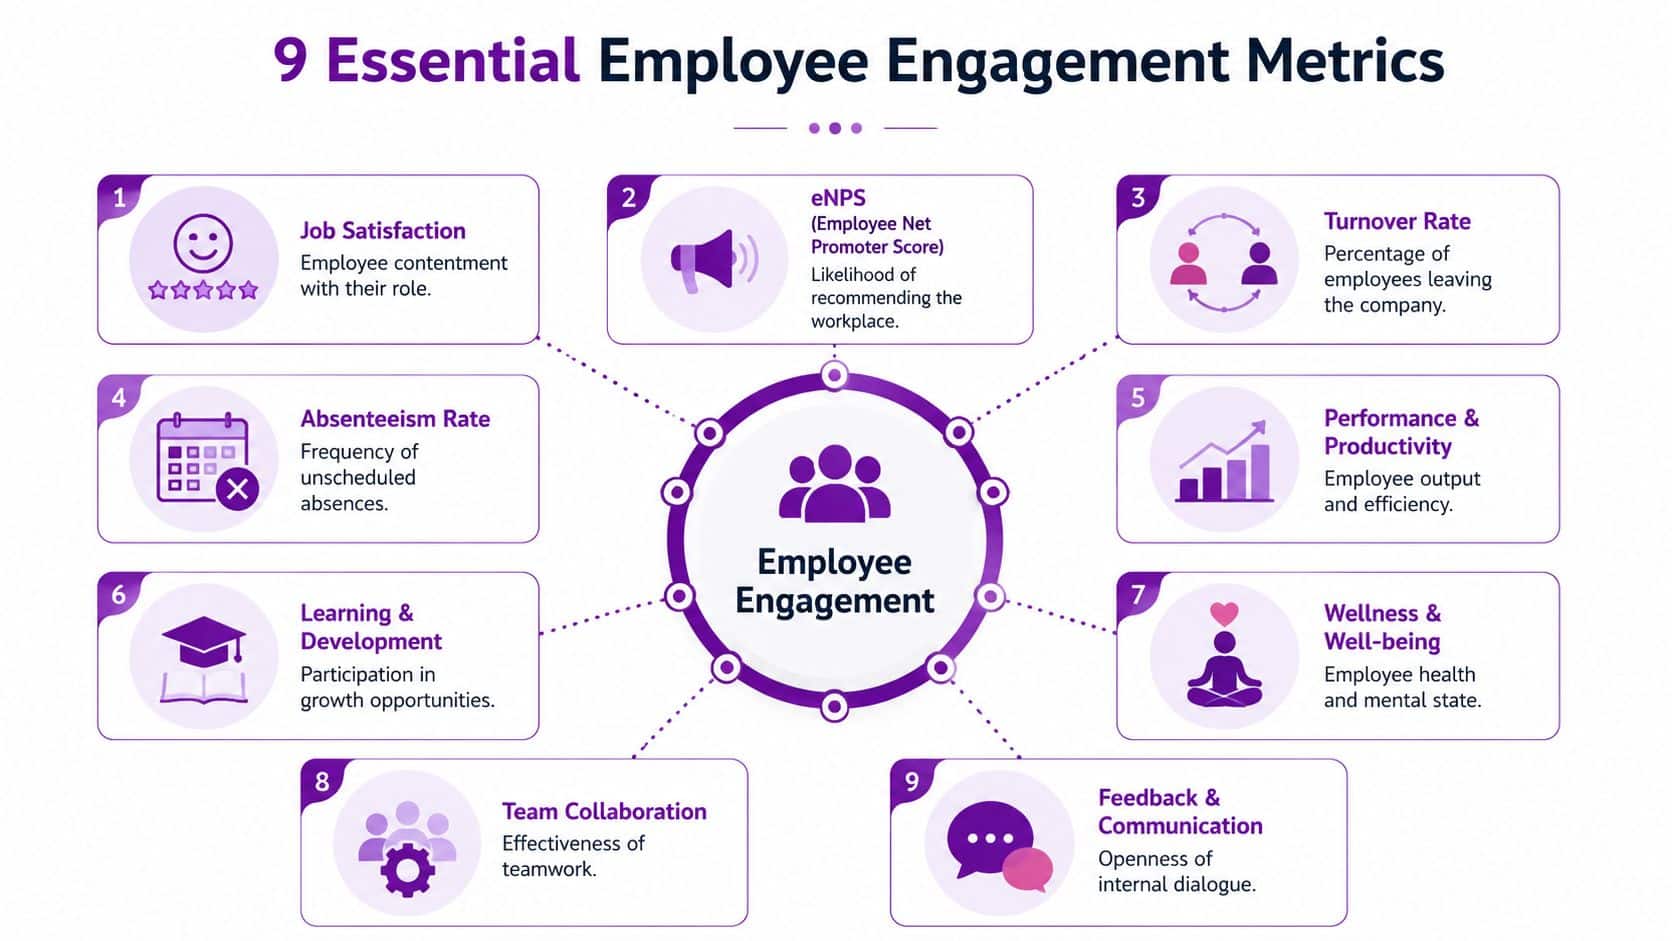
The 9 Essential Employee Engagement Metrics Explained
The strongest engagement model combines sentiment with observable behaviour. You need both. Sentiment without behaviour is vague. Behaviour without sentiment is lagging.
Survey-based metrics
1. eNPS
Employee Net Promoter Score measures whether employees would recommend your organisation as a place to work.
Formula: percentage of promoters minus percentage of detractors.
It's useful because it gives you a fast read on advocacy. It's not enough on its own, but it's a reliable top-line indicator when tracked over time and split by team, location, tenure, and manager.
2. Survey response rate
This tells you how many invited employees completed the survey.
Formula: completed surveys divided by invited employees.
Treat this as a data-quality metric, not a vanity metric. A weak response rate can mean distrust, fatigue, poor communication, or a badly timed survey. If your participation is patchy, your conclusions are shaky.
3. Pulse survey score
Pulse surveys work best when they're short, frequent, and tied to action. Instead of asking everything once a year, ask a few targeted questions more often.
You can calculate a pulse score using the average response across a small set of questions. The exact scoring model matters less than consistency. Keep the same structure long enough to trend it properly.
Later, if you want to sharpen retention planning, it's worth reviewing DataTeams' retention strategies, especially for how retention thinking becomes more practical when HR teams connect people outcomes back to manager and team-level signals.
4. Feedback and communication themes
Not every valuable metric needs to be a percentage. Open comments, structured manager feedback, and recurring themes in employee questions can be coded qualitatively and reviewed alongside quantitative scores.
Organisations often uncover the issue. “Workload” and “lack of clarity” require different responses. So do “manager inconsistency” and “career stagnation”.
A short walkthrough can help bring these categories to life:
Behavioural metrics
5. Voluntary turnover
This is one of the strongest engagement measures because it reflects a real choice. People leaving voluntarily often signals a failure in management, progression, workload, or employee experience.
Formula: voluntary departures divided by average headcount over a period.
UK labour-market data showed that the private-sector employee job-to-job transition rate reached 2.8% in Q3 2024, and for a 1,000-person organisation, a 1 percentage-point rise in annual voluntary turnover implies roughly 10 additional exits, according to QuestionPro's employee engagement metrics analysis. Segment this by department, tenure band, and manager or you'll miss the underlying issue.
6. Retention rate
Retention is the mirror image of turnover. It tells you who stayed, which matters when you're testing whether engagement initiatives are working.
The exact formula can vary by organisation, but the principle is straightforward. Track the proportion of employees who remain employed over the period you care about, then compare by cohort such as new starters, critical roles, or business unit.
7. Absenteeism
Unplanned absence is an operational signal that often exposes stress, burnout, poor management, or weak job design before bigger problems appear.
Typical calculation uses absent days or instances against available working time. Keep the formula consistent. Analyse it beside survey and team data rather than in isolation.
8. Internal mobility rate
If good people can't move internally, many will eventually move externally. Internal mobility is one of the clearest signals that your organisation offers progression rather than just promises it.
A practical formula is internal moves divided by the eligible employee population. Track promotions, lateral moves, and moves into development roles separately if possible.
9. Learning and development participation
This isn't a pure engagement metric, but it's an important supporting one. People who engage with development opportunities often show stronger commitment and a clearer future path inside the business.
Use completion, enrolment, and repeat participation as behavioural indicators. Don't overcomplicate it. The point is to see whether teams with weak development access also show weaker engagement or higher exits.
Key employee engagement metrics at a glance
| Metric | How to Calculate | Primary Data Source |
|---|---|---|
| eNPS | % promoters minus % detractors | Survey tool |
| Survey response rate | Completed surveys divided by invited employees | Survey tool |
| Pulse survey score | Average score across pulse questions | Survey tool |
| Feedback and communication themes | Qualitative coding of responses and comments | Surveys, manager notes, employee channels |
| Voluntary turnover | Voluntary departures divided by average headcount | HR system |
| Retention rate | Employees remaining over the period divided by relevant starting group | HR system |
| Absenteeism | Absent time or incidents against available working time | Time and attendance, HR system |
| Internal mobility rate | Internal moves divided by eligible employee population | HR system |
| Learning and development participation | Participation or completion across development activity | Learning records, HR system |
Practical rule: If a metric can't be split by team, manager, and time period, it probably won't help you fix anything.
How to Measure Engagement Natively in Microsoft Dynamics 365
Most engagement programmes fail for a boring reason. The data model is poor.
HR teams run a survey, export the results, merge them with headcount files, ask payroll for absence data, then build a report that's already out of date. Managers don't trust it, HR spends its time reconciling fields, and no one is sure which number is correct.

Build one people data spine
If you're in the Microsoft ecosystem, the smart approach is to measure engagement where your employee data already lives. That usually means using Dataverse, Dynamics 365, Power Apps, Power Automate, Microsoft Forms, Teams, SharePoint, and Power BI as one connected stack instead of separate point tools.
Here's what that changes:
- Core HR records feed retention, turnover, tenure, and mobility automatically
- Manager and team structures allow proper segmentation without manual spreadsheet mapping
- Time and attendance data can feed absence analysis
- Survey responses can be tied back to the right employee cohorts with appropriate controls
- Workflows can trigger alerts, action plans, or follow-ups when thresholds are breached
That single model matters because pulse surveys are more useful when paired with operational data. The ONS reported 148.9 million working days lost due to sickness or injury in 2024, and the practical value comes when you correlate low engagement scores with absence patterns in one integrated environment, as discussed in this guidance on engagement and operational metrics.
What native measurement looks like in practice
A sensible Dynamics-based setup usually includes:
Employee master data in Dataverse
Every metric needs a clean employee record. That means hire date, department, location, manager, status, contract type, and key movement history must be standardised. If that data is inconsistent, your engagement reporting will be inconsistent.
Pulse collection through Microsoft tools
Use lightweight pulse surveys through Microsoft-native tooling. Keep them short. Store the responses against consistent dimensions so you can trend them properly and analyse them later.
Workflow-driven follow-up
If one team drops sharply in sentiment or shows higher absence alongside lower participation, don't wait for the quarterly review. Trigger a manager task, an HR review, or a structured follow-up process.
A good related reference is performance management analytics in Microsoft environments, because engagement starts to matter when it connects directly to manager actions and operational outcomes.
If your HR team still exports three files to answer a turnover question, you don't have an engagement strategy. You have a reporting workaround.
Why native beats disconnected
A native Microsoft setup gives you a single source of truth, better security control, cleaner permissions, and less manual handling. It also makes engagement data more credible because HR, IT, and managers are all looking at the same underlying records.
That's what turns employee engagement metrics into something leaders will use.
Building Your Engagement Dashboard in Power BI
A good Power BI dashboard doesn't show everything. It shows what a director or manager can act on.
Start with the landing page. At the top, place your high-level indicators. eNPS trend, pulse trend, voluntary turnover trend, and absence trend. Not because those tell the whole story, but because they tell you where to look next.
The dashboard view that managers can actually use
The best dashboard I've seen for engagement had four zones on one screen.
The first zone tracked sentiment over time. A clean trend line showed eNPS and pulse movement by month or quarter. If the line dipped, you could filter by function, tenure, and manager immediately.
The second zone showed behavioural signals. A heatmap displayed absence by team. A bar chart ranked voluntary turnover by department. A simple breakdown of internal mobility helped identify whether high-performing teams were developing people or losing them.
The third zone focused on manager effect. If one manager's team showed lower survey sentiment, weaker participation, and more exits, that wasn't hidden inside a narrative slide. It was visible.
The fourth zone was diagnostic. It included comment themes, onboarding cohorts, and filters for location, business area, and employment type.
What each visual should answer
Use every chart to answer a management question.
- Trend line answers whether sentiment is improving or deteriorating
- Heatmap shows where absence pressure sits
- Bar chart reveals which teams are creating replacement risk
- Donut or stacked chart helps break leavers down by tenure or reason category
- Matrix view lets HR compare manager populations side by side
If you want a useful reference for layout thinking, especially how KPI structure affects dashboard design, this guide to tech recruiting KPIs and data structure is worth a look. The context is recruiting, but the reporting discipline applies equally well to engagement dashboards.
Drill-through is where Power BI becomes valuable
Power comes from drill-through. A director sees a turnover spike. One click takes them into that business area. Another click shows manager-level breakdown. Then they can compare sentiment, absence, and movement in the same view.
That's where HR stops acting like a reporting function and starts acting like an advisory function.
For organisations already shaping data stories in Microsoft, reporting for business is a useful companion read because the same principles apply. Keep the dashboard simple, segmented, and built around decisions.
Setting Benchmarks and Meaningful Targets
Most organisations set poor engagement targets. They either chase an arbitrary survey number or copy an external benchmark that doesn't fit their context.
Use external benchmarks carefully. They're helpful for perspective, not for management. Gallup's global benchmark that 62% of employees are not engaged and 17% are actively disengaged is useful because it reminds leadership that disengagement is widespread, not a niche issue. Gallup also found that highly engaged teams deliver 23% higher profitability, 81% lower absenteeism, and 59% lower turnover in high-turnover industries, which is why many UK employers treat engagement metrics as leading indicators rather than soft HR reporting, as summarised by CultureMonkey's review of engagement measurement.
Internal benchmarks matter more
Your real benchmark is your own organisation.
Compare:
- Current team against its own history
- One manager population against another
- New starter cohort against established employees
- Critical roles against non-critical roles
- One site or region against the rest of the business
That gives you context you can act on. If one function has stable eNPS but worsening absence, that tells a different story from a function with falling participation and rising exits.
External benchmarks provide context. Internal benchmarks drive action.
Set targets that force decisions
A useful target should lead to a real operational response.
Bad target: improve engagement score.
Better targets:
- Reduce voluntary turnover in a specific population
- Improve pulse consistency in one business unit
- Increase response quality in teams with low trust
- Lift internal mobility for employees with longer tenure
- Reduce absence concentration in high-pressure teams
Keep targets tied to business reality. If a team has weak manager scores and high exits, the target may be manager coaching. If new starters show poor sentiment, the target may be onboarding redesign.
Use a benchmark hierarchy
A practical hierarchy works like this:
| Benchmark Type | Best Use | Risk |
|---|---|---|
| External market benchmark | Board context and broad comparison | Encourages lazy target setting |
| Internal historical benchmark | Trend analysis over time | Misses hidden pockets if too aggregated |
| Internal segmented benchmark | Manager and team action planning | Requires clean data and governance |
The point isn't to find a magic number. The point is to decide what “good enough” looks like for each part of your organisation, then manage towards it with discipline.
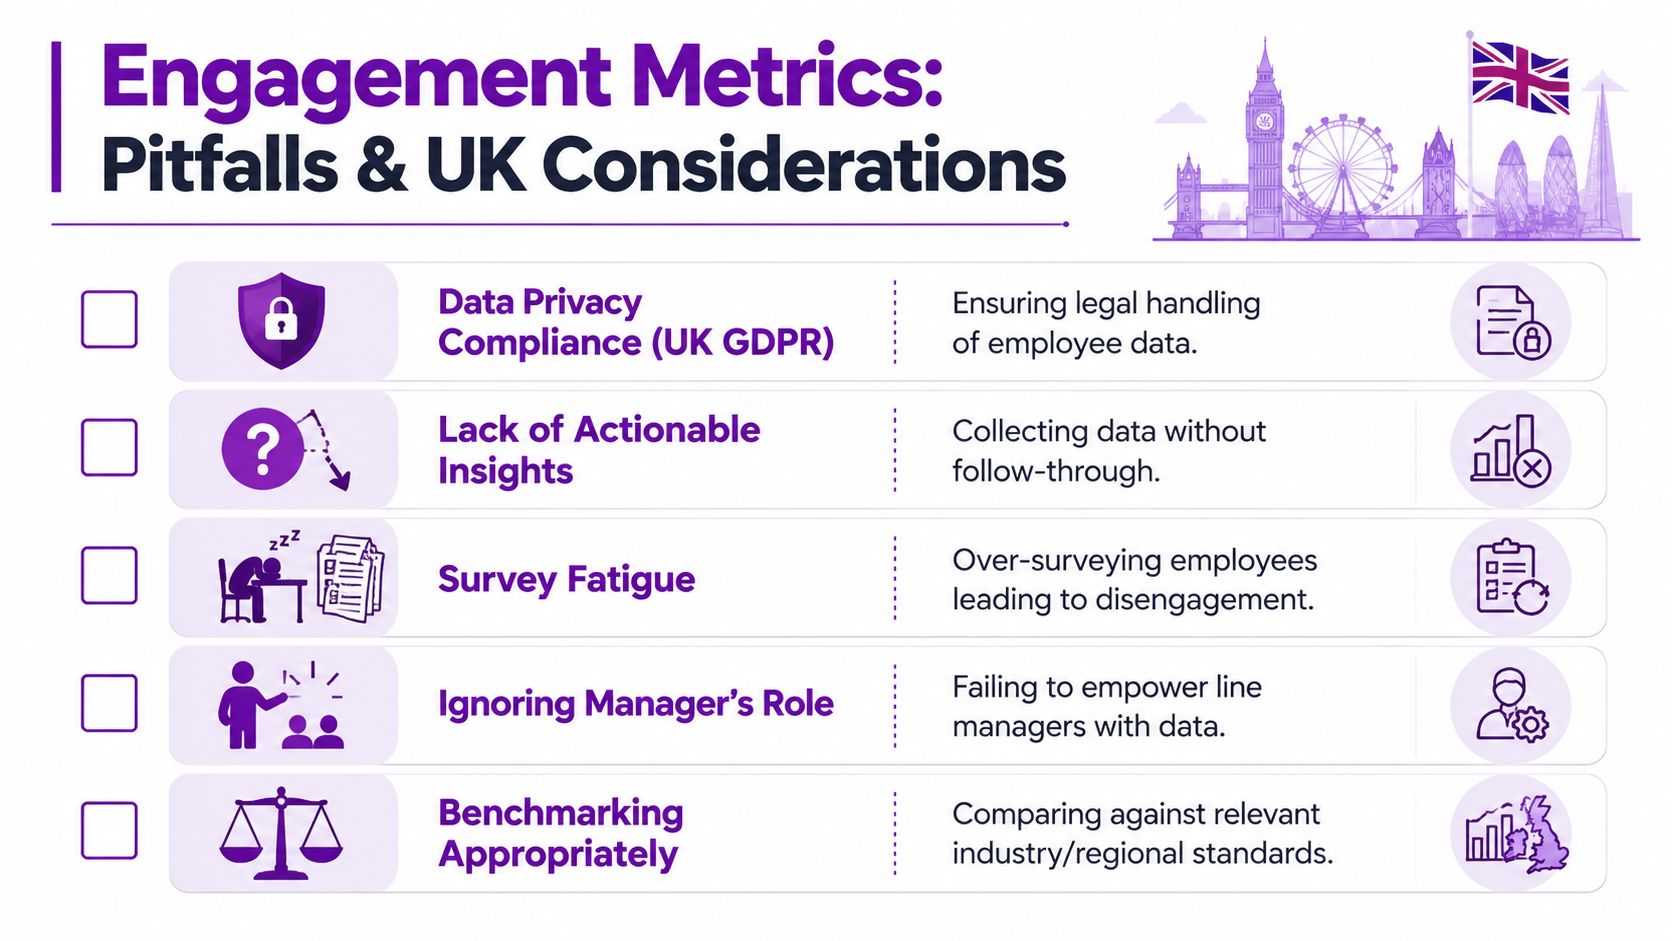
Common Pitfalls and UK-Specific Considerations
The usual advice says collect more feedback, run more pulses, build richer dashboards. That sounds sensible. It often makes things worse.
More data isn't better if employees don't trust the process, if response quality drops, or if your segmentation creates privacy risks. In the UK, those are not side issues. They are core design issues.
The biggest mistakes I see
Treating anonymity as a communications problem
It's not enough to tell employees their responses are anonymous. You need a design that makes that believable. Small team reporting, over-segmentation, and clumsy manager views destroy trust fast.
Reporting raw response rates as if they prove quality
They don't. A high participation rate with rushed, cautious, or unrepresentative responses is still weak data.
Flooding employees with pulses
Pulse surveys work when they are focused and linked to visible action. They fail when HR sends them too often and managers do nothing with the results.
Ignoring data governance
If your survey process, storage model, permissions, and retention approach aren't aligned to UK GDPR, stop and fix that before you expand measurement.
What UK organisations should do differently
Measurement quality under UK-specific constraints is a real challenge. Employees may distrust survey anonymity, hybrid work changes how people respond, and data must be handled carefully. That's why a better engagement model may be response-quality-adjusted, not just based on raw eNPS or participation rate, as highlighted in SmartSurvey's discussion of engagement measurement quality.
Use practical controls:
- Set minimum group sizes before showing segmented data
- Suppress small-team reporting where re-identification is possible
- Separate comment access from broad manager reporting when necessary
- Explain clearly how data is stored, used, and retained
- Limit survey frequency to what managers can realistically act on
A lower-volume survey programme with stronger trust will outperform a high-frequency programme that staff don't believe in.
The contrarian view that actually works
The best engagement metric may not be the biggest number on the dashboard. It may be the one you trust enough to act on.
That means quality before quantity. Governance before granularity. Credibility before reporting volume.
From Metrics to Meaningful Action
Most organisations don't have an engagement measurement problem. They have an action problem.
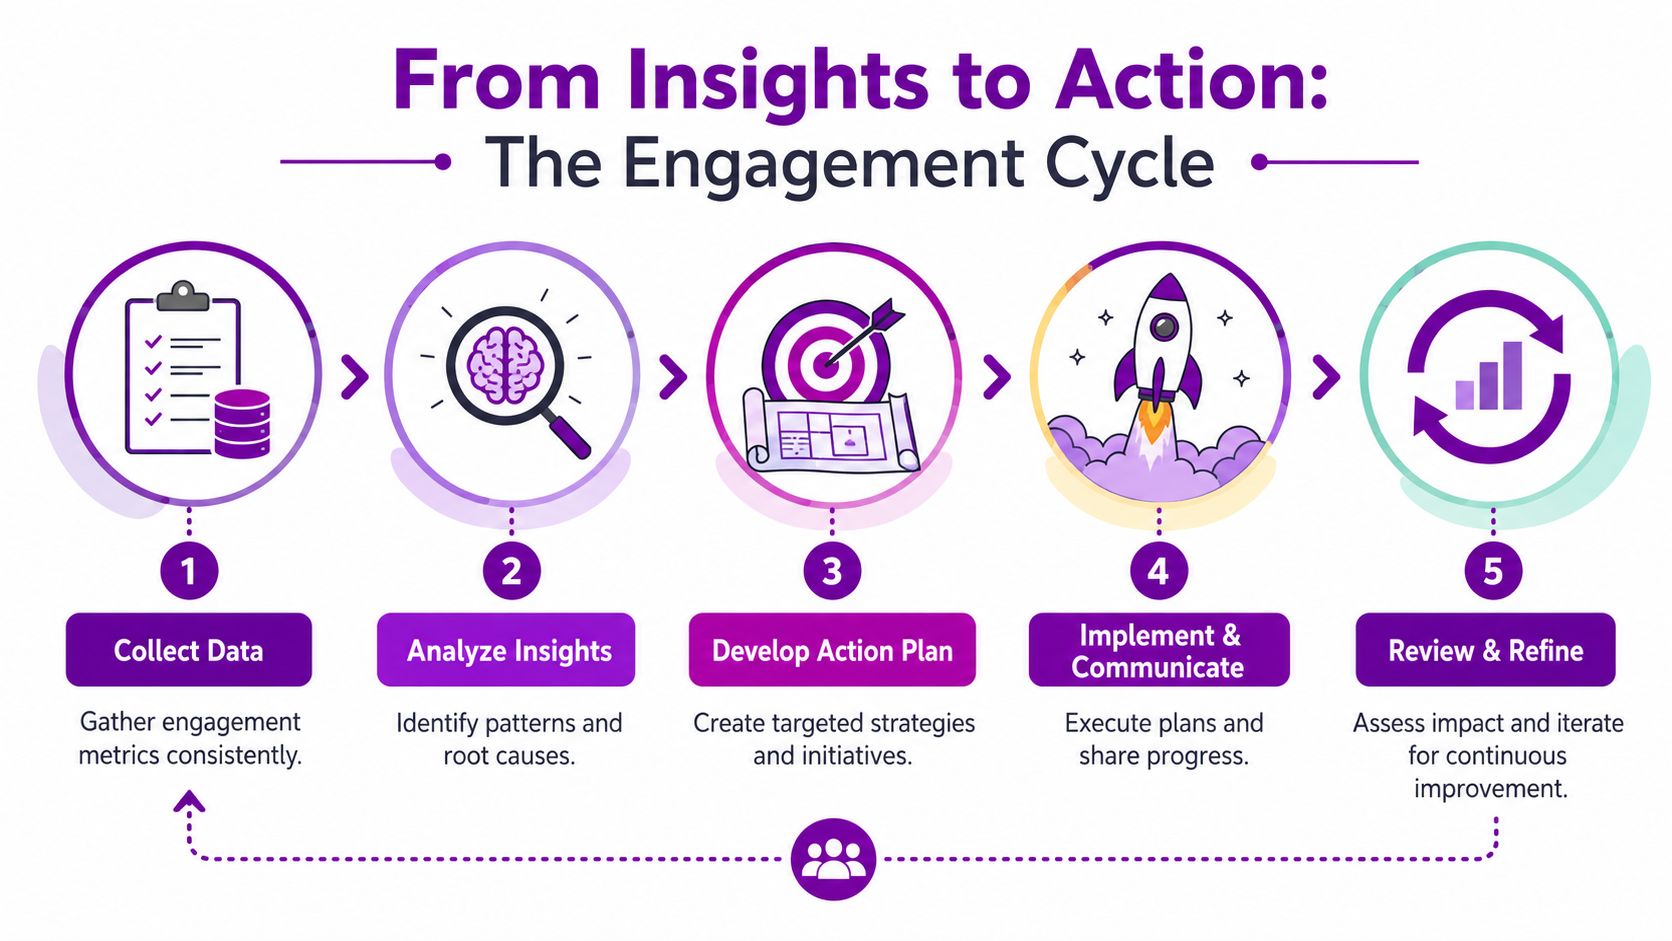
The right cycle is simple. Measure. Analyse. Act. Review. Repeat. If one department shows weak pulse scores and rising absence, the answer isn't another slide deck. It's a manager conversation, workload review, and follow-up check. If new starters score poorly, fix onboarding. If one function has poor internal movement, review role design and development access.
A practical operating rhythm
Run engagement like this:
- Collect focused data from pulse surveys and core HR records
- Review patterns monthly at organisation, function, and manager level
- Assign actions to named leaders, not generic workstreams
- Track whether the action changed the metric
- Refine the next pulse based on what you learned
To make those actions stick, connect them to management priorities. A useful resource for that is HR OKR examples, especially if you want engagement work to sit inside a broader people and business planning framework rather than as a side project.
What this looks like in a Microsoft-centric organisation
When engagement, absence, movement, manager hierarchy, and reporting all sit in the same Microsoft environment, HR stops chasing files and starts guiding decisions. That's the shift that matters.
We are DynamicsHub.co.uk. Experience HR transformation built around your business. Hubdrive's HR Management for Microsoft Dynamics 365 is the premier hire-to-retire solution, more powerful, more flexible, and more future-ready than Microsoft Dynamics 365 HR. By unifying all your people data on a single, secure platform you already own, you can move from guessing to knowing, and from reacting to leading.
DynamicsHub helps UK organisations build HR transformation around the Microsoft ecosystem they already use. If you want a more connected approach to employee engagement metrics, workforce reporting, and hire-to-retire HR management, contact DynamicsHub to discuss your requirements. Ready to transform your employee engagement strategy? Phone 01522 508096 today, or send us a message at DynamicsHub contact page.