If you're leading HR in a UK business, this probably feels familiar. Headcount sits in one spreadsheet, absence data lives in another, recruitment figures come from an ATS export, and payroll gives you a different version of the truth again. Then the board asks a simple question such as, “Which teams are most at risk of losing critical people this quarter?” and the honest answer is that you can't see it clearly enough.
That gap is where workforce analytics starts to matter. Not as a fashionable dashboard project, and not as a data science exercise, but as a practical way to connect people decisions to business outcomes. For mid-market organisations using Microsoft 365, Dynamics 365, Power BI and the Power Platform, the good news is that you often already own much of the foundation. The harder part is moving from static reporting to decisions that are timely, trusted and useful.
Most organisations don't need more reports. They need fewer reports, better questions, cleaner data, and a process that turns insight into action.
Moving Beyond Spreadsheets and Gut Feelings
A lot of HR teams still spend too much time reconciling figures instead of analysing them. One file says 842 employees, another says 857, and neither explains why one division has had a sudden rise in resignations or why time-to-fill is drifting upwards for specialist roles. That's basic reporting. It tells you what has already happened, often too late to change the outcome.
Workforce analytics is different. It uses workforce data to support business decisions with more confidence and more precision. That can mean spotting patterns in absence before they affect service delivery, linking turnover to manager capability, or seeing whether internal mobility is reducing external hiring pressure.
A useful way to think about it is this. Reporting counts activity. Analytics supports action.
What changes when HR becomes analytical
When HR leaders move beyond spreadsheets, the conversation with finance and operations changes as well. Instead of presenting monthly metrics in isolation, you start answering commercial questions:
- Retention risk: Which teams are showing the strongest indicators of unwanted turnover?
- Hiring pressure: Where are vacancies taking longest to fill, and what is that doing to service levels?
- Capability gaps: Which roles are repeatedly hard to recruit, signalling a training or succession issue?
- Manager impact: Are engagement, absence and exits clustering around specific reporting lines?
That's where HR becomes more than an administrative function. It becomes a source of operational intelligence.
Why the opportunity is still open
There's still space for mid-market firms to move ahead quickly. A 2021 CIPD survey found that only around 26% of UK organisations use data to regularly support HR decisions, which means many businesses are still operating with limited visibility into workforce risk and performance (CIPD workforce analytics research).
Practical rule: If your board asks forward-looking workforce questions and your current reports only describe the past, you're ready for workforce analytics.
In practice, the first leap isn't technical. It's managerial. You stop asking, “What can we report?” and start asking, “What decisions do we need to make better?”
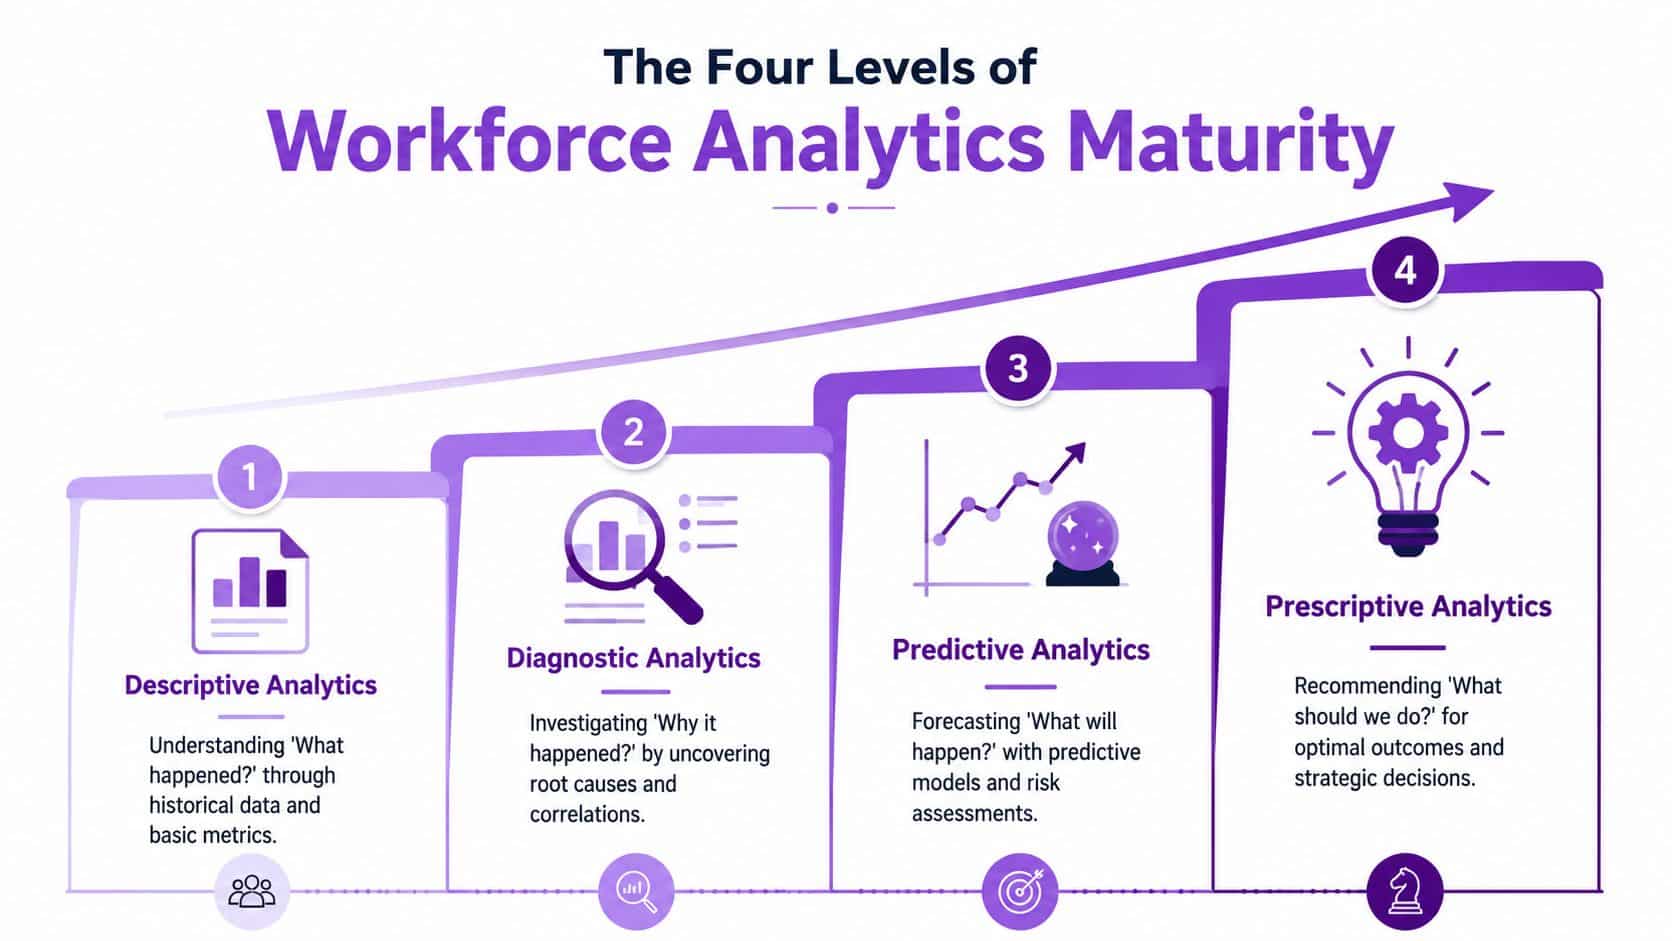
The Four Levels of Workforce Analytics Maturity
Most organisations don't jump straight into predictive models. They move through stages. That matters because a team that still argues over basic headcount definitions won't get much value from advanced forecasting.
Think of maturity like navigation. At the lowest level, you're reading yesterday's map. At the highest level, you're using a system that sees the road ahead and suggests the best route based on live conditions.
Level one to level four
Descriptive analytics
This is the starting point. You measure what happened.
Typical outputs include headcount, turnover, absence, vacancies, overtime, and training completion. Useful, but limited. You can see patterns in the rear-view mirror, but you can't yet explain them properly.
Diagnostic analytics
Analysis begins to show its value. You ask why something happened.
For example, a rise in turnover may be concentrated in one location, one manager population, or one pay band. Time-to-fill may be slower not because recruitment is underperforming, but because approvals take too long or hiring managers keep changing role requirements.
Predictive analytics
Here, the discussion becomes strategic. You use historical and current data to estimate what's likely to happen next.
That could mean attrition risk, expected hiring pressure, probable absence hotspots, or workload forecasts for service teams. You're no longer waiting for a problem to land. You're identifying where it's likely to emerge.
A short explainer is helpful here:
Prescriptive analytics
This is the most mature stage. The data doesn't just predict risk. It helps you decide what to do next.
That might involve recommending targeted retention actions for a high-risk team, adjusting recruitment channels for hard-to-fill roles, or testing staffing scenarios in a contact centre before schedules are published.
Why this matters now
The market has moved on from standalone HR systems and static reports. The UK's HR technology market, including workforce analytics, was estimated at £1.1 billion in 2022 and projected to grow at around 10 to 12% annually, driven by demand for integrated platforms with native analytics such as Dynamics 365 (Statista UK HCM market data).
Organisations that stay at descriptive reporting usually feel busy. Organisations that progress to predictive and prescriptive analytics usually make better workforce decisions.
A realistic maturity check
If you're assessing your own position, use these prompts:
- Descriptive: Are your core workforce numbers trusted?
- Diagnostic: Can you explain the main drivers behind movement in those numbers?
- Predictive: Can you identify likely risk before it becomes visible in monthly reporting?
- Prescriptive: Can managers act on recommended interventions with confidence?
If you can only answer yes to the first point, that's normal. It also tells you where to start.
Measuring What Matters Key Workforce KPIs
A common mistake is building a dashboard with everything in it. That usually creates noise, not insight. For most UK organisations, a better approach is to choose a small set of KPIs tied directly to business priorities such as retention, recruitment efficiency, labour cost control, or service delivery.
Start with the business question
If the pressing issue is unwanted attrition, your KPI set should look different from a business struggling with field-service capacity or hard-to-fill vacancies. The right metrics are the ones that help somebody make a decision.
Two core formulas are used widely in UK HR practice:
- Turnover Rate = (number of separations ÷ average headcount) × 100
- Time-to-Fill = total days to fill roles ÷ number of roles filled
Used consistently, these measures help HR set clear targets, including goals such as a 90% retention rate for key staff (UK workforce analytics KPI formulas).
Essential Workforce Analytics KPIs for UK Businesses
| Business Goal | KPI | Calculation | Strategic Question Answered |
|---|---|---|---|
| Improve retention | Turnover Rate | (number of separations ÷ average headcount) × 100 | Are we losing people faster than the business can absorb? |
| Improve retention | Voluntary turnover in critical roles | Same turnover formula, limited to critical roles and voluntary exits | Are we losing talent that is hard to replace? |
| Improve recruitment | Time-to-Fill | total days to fill roles ÷ number of roles filled | How quickly are we closing vacancies? |
| Improve recruitment | Cost-per-Hire | (recruiting + onboarding costs) ÷ number of hires | Are we hiring efficiently for the quality of talent secured? |
| Improve productivity | Revenue per FTE | Revenue divided by full-time equivalent headcount | Is workforce growth translating into output? |
| Improve workforce stability | Absence rate | Organisation-defined absence measure tracked consistently | Is short-term disruption rising in specific teams or sites? |
| Improve talent mobility | Internal fill rate | Internally filled roles divided by total filled roles | Are we building capability from within or relying on external hiring? |
What works and what doesn't
What works:
- A limited KPI set: usually five to ten metrics.
- Consistent definitions: one agreed formula per metric.
- Segmented views: by role family, site, manager, function, or region.
- Regular review: monthly is often enough to spot movement and act.
What doesn't:
- One giant dashboard: leaders stop using it.
- Unowned measures: nobody knows who validates the data.
- Vanity metrics: figures that look good but don't drive action.
- No operational context: numbers are shown without linking them to vacancies, service pressure, or cost.
For teams refining operational measures alongside workforce KPIs, this guide to operational efficiency metrics is a useful companion because it helps connect HR data to broader business performance.
The best KPI dashboard is not the most comprehensive one. It's the one managers actually use to change decisions.
Workforce Analytics in Action UK Use Cases and ROI
The value of workforce analytics becomes clearer when you apply it to real operational problems. Two use cases show where UK organisations usually see traction first: attrition risk and workforce scheduling.
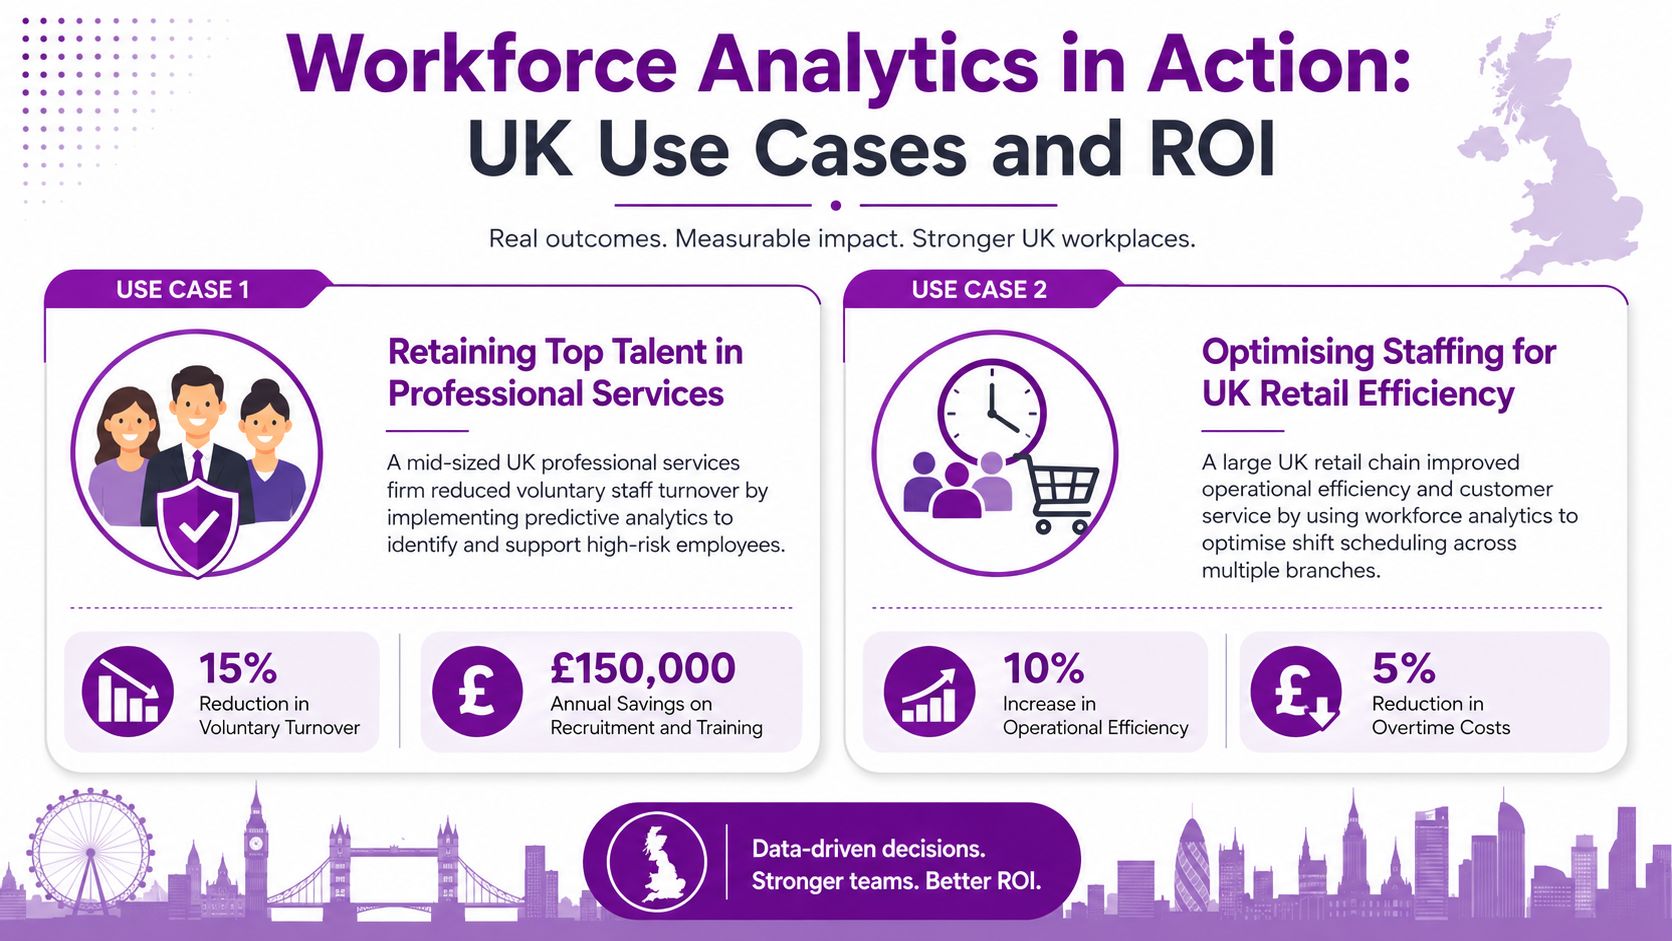
Use case one reducing unwanted turnover
For mid-sized firms, turnover often feels personal and unpredictable. In reality, some patterns are measurable. UK organisations using people analytics to model attrition risk have reduced unwanted turnover by up to 18% over 18 months, and the strongest predictors include tenure, absence rates, and manager engagement scores. That finding comes from a 2023 CIPD survey, referenced here qualitatively to avoid repeating the same source link elsewhere.
What does that look like in practice? An HR team combines core HRIS fields such as tenure, role, pay grade, and location with absence patterns and engagement data. Once those fields sit in one model, certain teams start to stand out. Not because one person is unhappy, but because a cluster of indicators suggests rising exit risk.
What to watch in the data
The strongest signals in UK-specific attrition modelling include:
- Length of service: especially movement within the first two years.
- Role changes: frequent movement can signal both ambition and instability.
- Absence: patterns above six days per year may indicate disengagement or pressure.
- Manager-rated engagement: low scores often correlate with future exits.
The practical gain isn't the model itself. It's the intervention. HR can direct mentoring, flexible working discussions, pay reviews, or development planning at teams with the highest risk, instead of applying blanket retention activity across the whole organisation.
Use case two improving service operations
Workforce analytics also matters outside core HR. In contact centres and field-service environments, staffing accuracy has direct consequences for service performance, labour cost and customer experience.
UK contact-centre and field-service operations using scheduling and performance data have shown schedule adherence improvements of 12 to 15 percentage points, while Ofcom-aligned benchmarks indicate that organisations deploying advanced scheduling analytics can lower abandonment rates by 8 to 11% and increase first-contact resolution by 7 to 10 percentage points. UK-focused operational benchmarking has also found forecast errors reduced by 22 to 28% over a 12-week period when predictive scheduling models use historical volume, agent-level performance and interval-level absence data.
Where the ROI really comes from
The strongest return usually comes from four places:
- Reduced replacement cost: fewer unwanted resignations means less spend on recruitment and onboarding.
- Lower disruption: critical roles stay filled for longer.
- Better staffing accuracy: fewer avoidable overtime and coverage gaps.
- Improved manager action: interventions become targeted rather than generic.
If you're trying to build the business case, don't start with a vague claim about insight. Start with one problem the board already cares about, then show how workforce analytics can change that outcome.
The Dynamics 365 and Power Platform Advantage
Many mid-market organisations already have the right technology estate for workforce analytics, but they're not using it as one connected platform. Data sits across Microsoft 365, payroll, recruitment tools, service systems and spreadsheets. The issue usually isn't lack of software. It's lack of integration and ownership.

Why the Microsoft stack fits this use case
For UK firms using Dynamics 365 and the Power Platform, the most practical route is to build analytics on top of the systems staff already use. Dataverse gives you a shared data layer. Power BI provides visual analysis. Teams becomes the delivery channel. Power Apps and Power Automate help close the loop from insight to action.
That matters because workforce analytics fails when it becomes a separate side project. If managers have to leave their normal systems, log into another tool, export another file and interpret another dashboard, adoption drops quickly.
A broad market challenge supports this point. Many UK mid-market firms struggle because most workforce analytics guidance is written for large enterprises with bigger teams and heavier BI estates. There's a clear need for practical implementation guidance built around accessible tools such as Microsoft Power Platform and UK requirements including Right to Work and GDPR (mid-market workforce analytics guidance).
What a good architecture looks like
A sensible Microsoft-based model usually includes:
- Core HR data in Dataverse: one source of truth for employee, job, organisational and lifecycle data.
- Power BI for dashboards: role-based views for HR, finance, operations and managers.
- Teams for access: insight delivered where line managers already work.
- Automation for action: create tasks, trigger reviews, or prompt managers when thresholds are met.
- Security through Microsoft controls: role-based access via Entra ID and governed data access patterns.
For leaders who want a plain-English overview of why Power BI is so useful in this context, the Professional Careers Training Power BI guide is a solid resource. It explains the reporting and decision-making value without drowning the reader in technical jargon.
Why native HR data matters
Product choice then becomes important. Hubdrive's HR Management for Microsoft Dynamics 365 is designed as a hire-to-retire platform built natively on Dataverse. In practical terms, that means your recruitment, onboarding, employee records, absence, documents, workflows and compliance data can sit in the same Microsoft data estate rather than being stitched together after the fact.
If you're comparing platform options, this overview of Dynamics 365 HR helps frame the conversation around integration, flexibility and long-term fit.
Separate HR systems often create separate truths. Native data architecture gives you a much better chance of producing analytics that people trust.
Your Phased Implementation Roadmap
Most workforce analytics programmes go wrong in one of two ways. Either the organisation buys dashboards before agreeing the questions, or it tries to solve every HR problem at once. A phased approach works better.
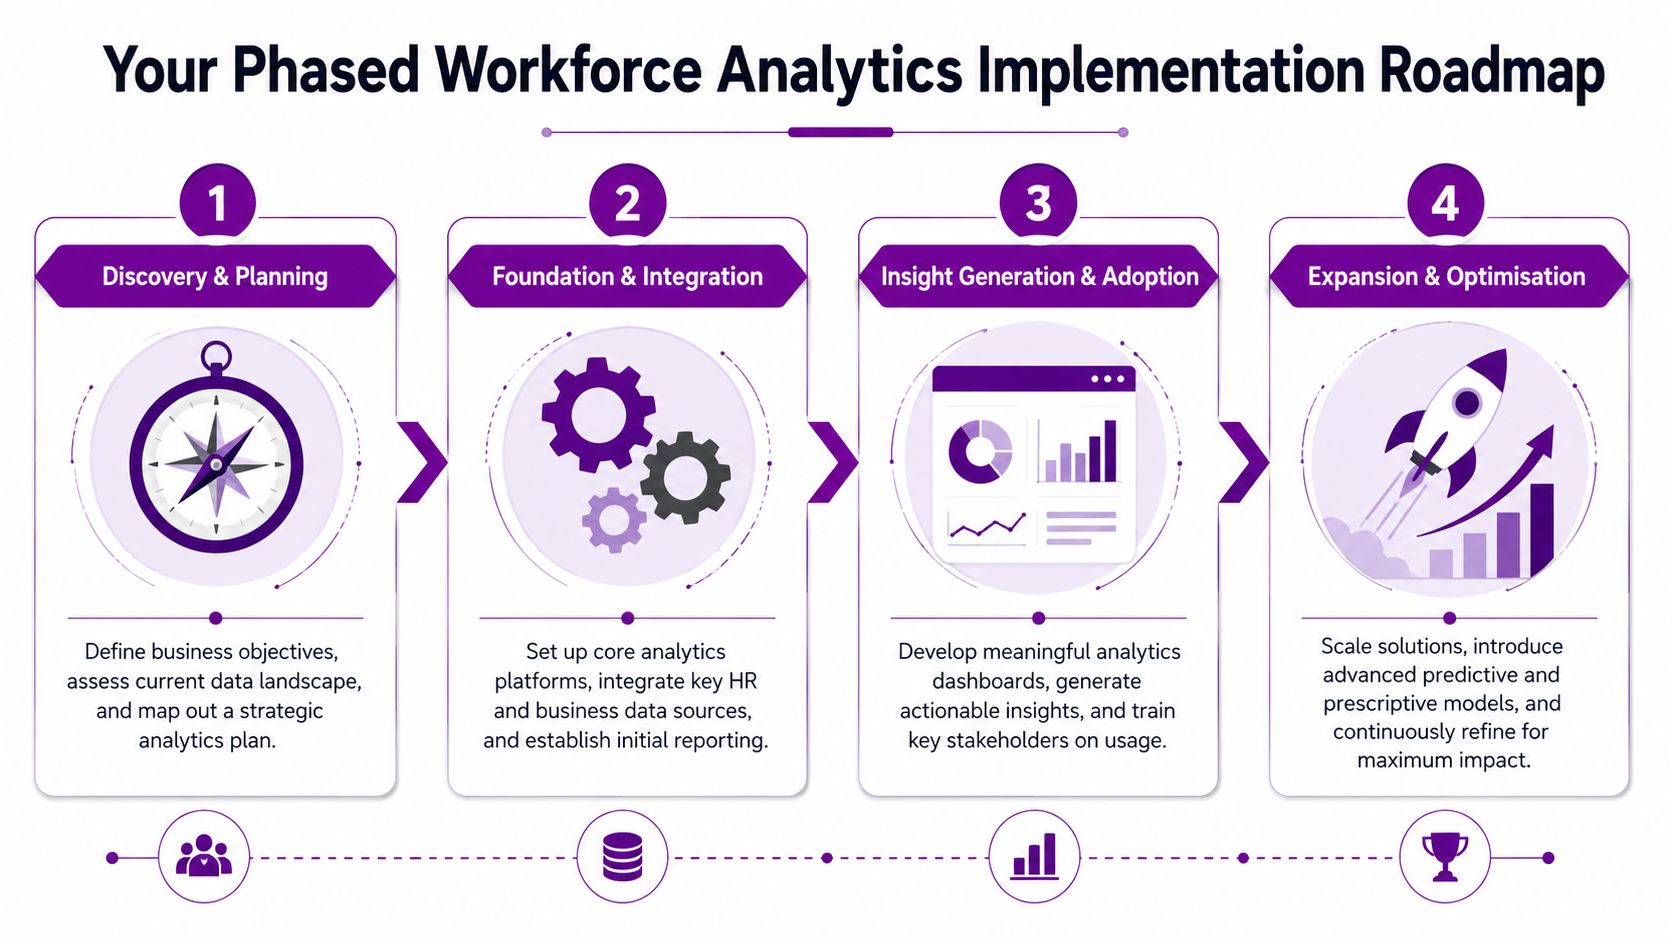
Phase one define the decisions
Start with business questions, not technology. Pick one or two problems that matter commercially. Examples include unwanted turnover in fee-earning roles, delays in hiring engineers, or staffing pressure in customer operations.
Get HR, finance, IT and the relevant business leader in the room. If they can't agree the business question, they won't agree the value of the answer.
Phase two audit the data
Now test what you have. Where does employee master data live? Who owns vacancy data? Are absence reasons coded consistently? Can you identify manager hierarchies cleanly?
This stage is often uncomfortable, because it exposes duplication and poor data discipline. That's useful. Better to find out now than after a dashboard has gone live.
Phase three integrate the platform
Once the key datasets are known, integrate them into a manageable model. In a Microsoft environment, that usually means using Dataverse as the core layer, then shaping role-based views in Power BI.
Keep the first release narrow. A focused dashboard for one issue is far more valuable than a sprawling portal nobody trusts.
Phase four pilot with one use case
Choose a pilot that has visible business impact and a realistic path to intervention. Attrition risk in a hard-to-replace role group is usually a strong candidate. Scheduling analytics in service operations can also work well if the data is already structured.
A good pilot has three features:
- A clear owner who will act on the insight.
- A stable data set that doesn't depend on too many manual inputs.
- A measurable outcome tied to a real business concern.
Phase five scale and refine
Once the pilot is stable, expand carefully. Add more teams, more managers, or a second use case. Tighten definitions, improve dashboard usability, and review whether interventions are changing outcomes.
This is also the point where governance has to mature. As analytics becomes more influential, data access, retention, and explainability become much more important.
Don't scale dashboards first. Scale trust first.
Data Governance and Starting Your Journey
In UK workforce analytics, governance isn't an add-on. It's part of whether the programme succeeds. If employees and managers think analytics is opaque, intrusive, or unfair, adoption stalls. If the data is poorly controlled, the legal and reputational risk grows just as quickly as the analytical capability.
The employee trust issue is real. An ICO report in 2023 highlighted that UK employers often fail to explain clearly how people analytics data is used, even though nearly 80% of UK workers want that use of data to be transparent (ICO guidance on people analytics transparency).
What good governance looks like
A robust framework usually includes:
- Clear purpose statements: why each workforce data set is collected and how it is used.
- Role-based access controls: not everyone should see the same level of detail.
- Retention rules: aligned to UK employment law and internal policy.
- Aggregation and anonymisation: especially for sensitive workforce patterns.
- Manager guidance: what they can act on, and what they must not infer.
- Auditability: who accessed what, when, and for what purpose.
UK-focused guidance also shows that organisations combining workforce analytics with clear governance and employee consent frameworks report up to 33% higher trust in people data. The broader lesson is simple. Analytics works better when staff understand the rules and believe the process is fair.
Practical safeguards in Microsoft environments
Microsoft-based organisations can put strong controls in place without creating a separate compliance stack. In practice that often means:
- Entra-based permissions for role-sensitive access
- Dataverse security roles to restrict sensitive HR entities
- Power BI row-level security for manager and regional views
- Retention and archiving policies aligned to UK GDPR expectations
- Documented review processes before new metrics or predictive flags are introduced
For teams reviewing the legal and operational side of this, a practical GDPR compliance checklist helps turn policy into action.
Starting well matters more than starting big
The best workforce analytics programmes don't begin with an executive promise of AI-driven transformation. They begin with one hard business problem, one trusted data set, one accountable owner, and one governance model people can defend.
That's how you move from reports nobody reads to workforce decisions that are timely, grounded and commercially useful.
DynamicsHub helps UK organisations build that kind of HR transformation around their actual business, not a generic template. Experience HR transformation built around your business. Hubdrive's HR Management for Microsoft Dynamics 365 is the premier hire-to-retire solution, more powerful, more flexible, and more future-ready than Microsoft Dynamics 365 HR. If you want a practical route to workforce analytics inside your existing Microsoft investment, contact DynamicsHub or Phone 01522 508096 today.